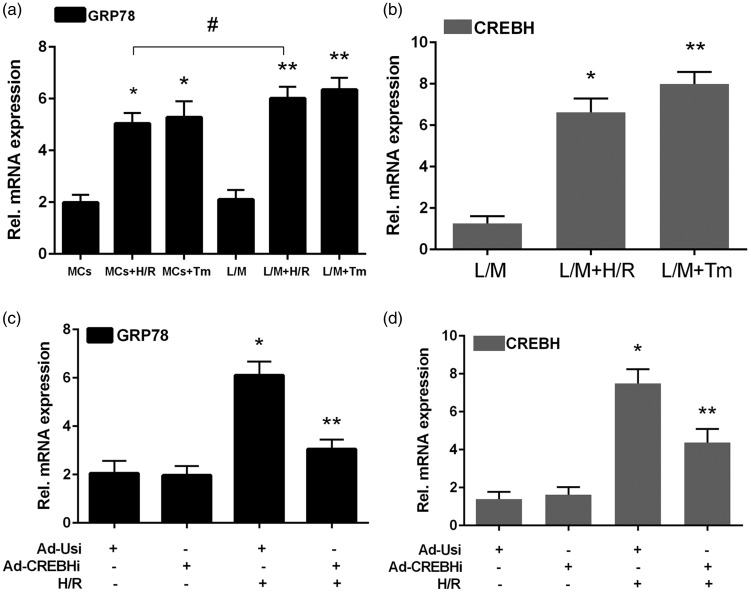
Figure 3.
Relative GRP78 and CREBH mRNA expression levels using RT-PCR. a: RT-PCR results of GRP78 in the MCs + H/R, MCs + Tm, L/M + H/R, L/M + Tm, and untreated control groups. b: Relative GPR78 mRNA expression levels in the L/M, L/M + H/R, and L/M + Tm groups. c: RT-PCR results of GPR78, CREBH-FL, and CREBH-N using Ad-CREBHi and Ad-USi. d: Relative CREBH mRNA expression levels CREBH-FL and CREBH-N with Ad-CREBHi and Ad-USi. Note *P < 0.05 vs the control group.
Tm: tunicamycin, H/R: hypoxia/reperfusion, MCS: myocardial cells, L/M: lower compartment and hepatocytes, Ad-USi: adenovirus for the unspecific, Ad-CREBHi: adenovirus for cyclic AMP-responsive element-binding protein H (CREBH) RNAi.

