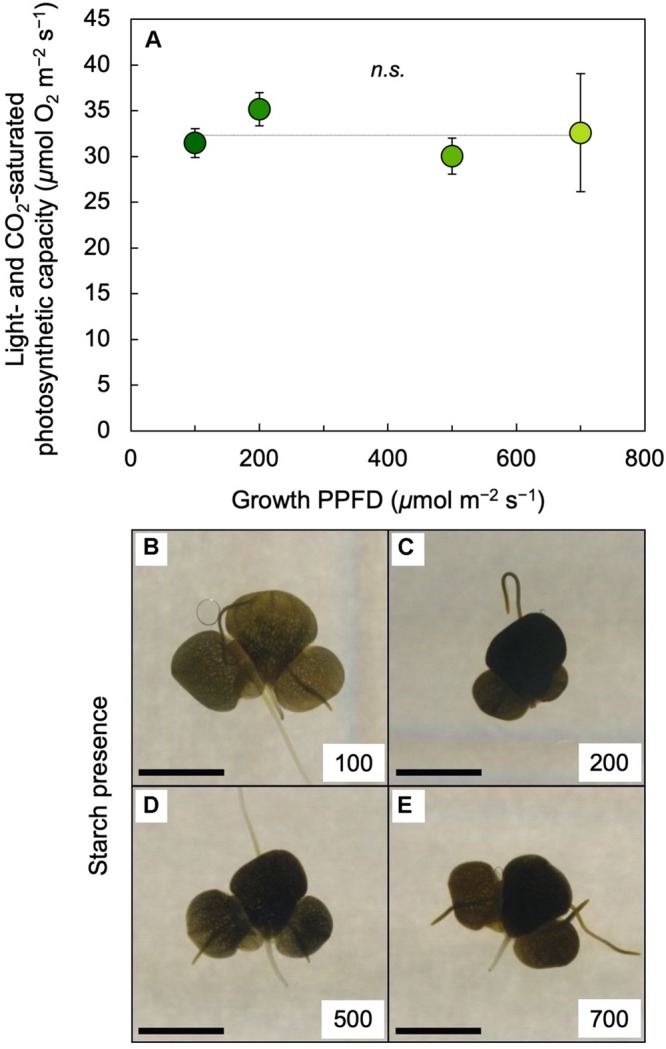
FIGURE 7.

(A) Light- and CO2-saturated rate of oxygen evolution determined at 25°C and (B through E) iodine stain (as a qualitative test for starch presence) of L. gibba fronds as a function of growth PPFD. The numbers (100 to 700) in each of the panels B through E correspond to the PPFD (in μmol photons m–2 s–1) under which fronds were grown; the scale bars represent 5 mm. In A, mean values ± standard deviations, n = 3 for all growth PPFDs; n.s., not significantly different at P < 0.05 via one-way analysis of variance. Mean values ± standard deviations for frond dry mass per area (g m–2) were 26.4 ± 2.2, 37.4 ± 5.5, 37.9 ± 5.3, and 37.8 ± 3.8 for growth PPFDs of 100, 200, 500, and 700 μmol m–2 s–1, respectively (n = 3 for all growth PPFDs).
