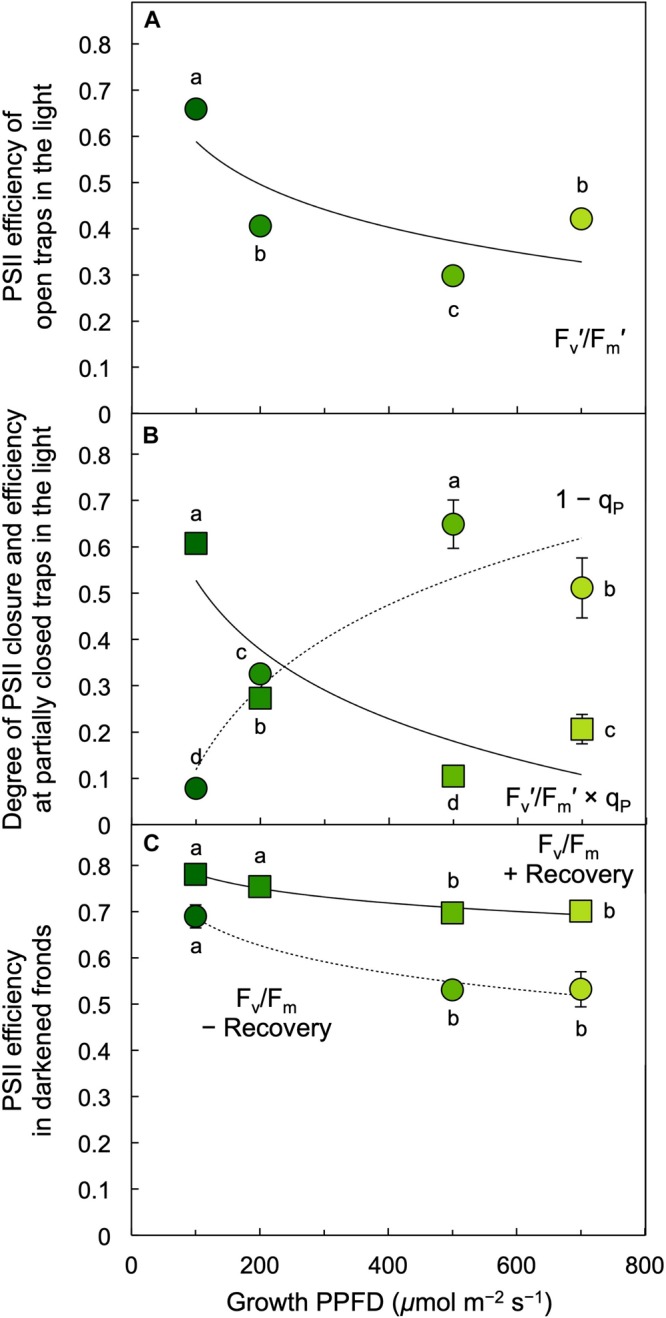
FIGURE 8.

(A) Efficiency of open photosystem II (PSII) centers (traps) during exposure to each respective growth PPFD, (B) fraction of PSII reaction centers (traps) that are closed, 1 – qP = (F – Fo′)/(Fm′ – Fo′) (circles), and PSII efficiency at the degree of center closure (Fv′/Fm′ × qP; squares) under each respective growth PPFD, and (C) the efficiency of PSII in the dark (Fv/Fm) in L. gibba fronds grown under each respective PPFD. Dark Fv/Fm was determined immediately upon removal of fronds from growth light conditions (– Recovery) and again after 30 min in low light (+ Recovery). Fm′, maximal fluorescence under actinic light; Fv′, variable fluorescence under actinic light (Fm′ – minimal fluorescence Fo′); PSII, photosystem II; qP, photochemical quenching. Mean values ± standard deviations, n = 3 for all growth PPFDs; different lower-case letters signify statistical differences at P < 0.05 via one-way analysis of variance and post hoc Tukey–Kramer HSD test.
