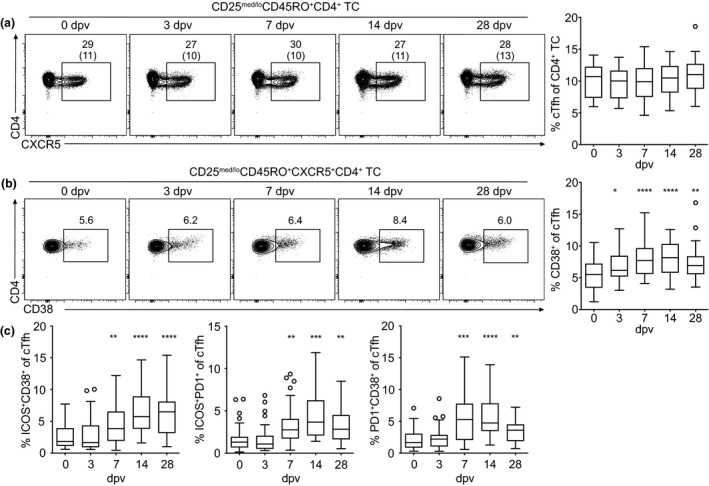
Figure 1.

Circulating Tfh cells upregulate activation markers following YF‐17D vaccination. (a–c) PBMCs isolated before (day 0) and at the indicated time points after YF‐17D vaccination were analysed by flow cytometry (see Supplementary figure 1 for the gating strategy). Representative contour plots and quantification of (a) cTfh frequency and (b, c) cTfh activation determined by CD38, ICOS and PD‐1 expression after yellow fever vaccination are shown. Gate frequencies indicate the frequency in regard to the parent gate. Gate frequencies in brackets indicate the frequency of the population in regard to the reference population as indicated above. (a–c) Frequencies of Tfh cells and their activation status pooled from four independent experiments with 5 to 10 study participants each are presented as Tukey boxplots showing the median with the 25th and 75th percentile (n = 33) and whiskers and outliers calculated as highest and lowest observation below/above 1.5 times interquartile range. Data points below/above 1.5 times interquartile range are displayed individually. Statistical analysis was performed using repeated‐measure (RM) one‐way ANOVA and Dunnett's multiple comparison analysis to compare indicated time points to day 0. *P < 0.0332, **P < 0.0021, ***P < 0.0002, ****P < 0.0001. dpv, day(s) post‐vaccination.
