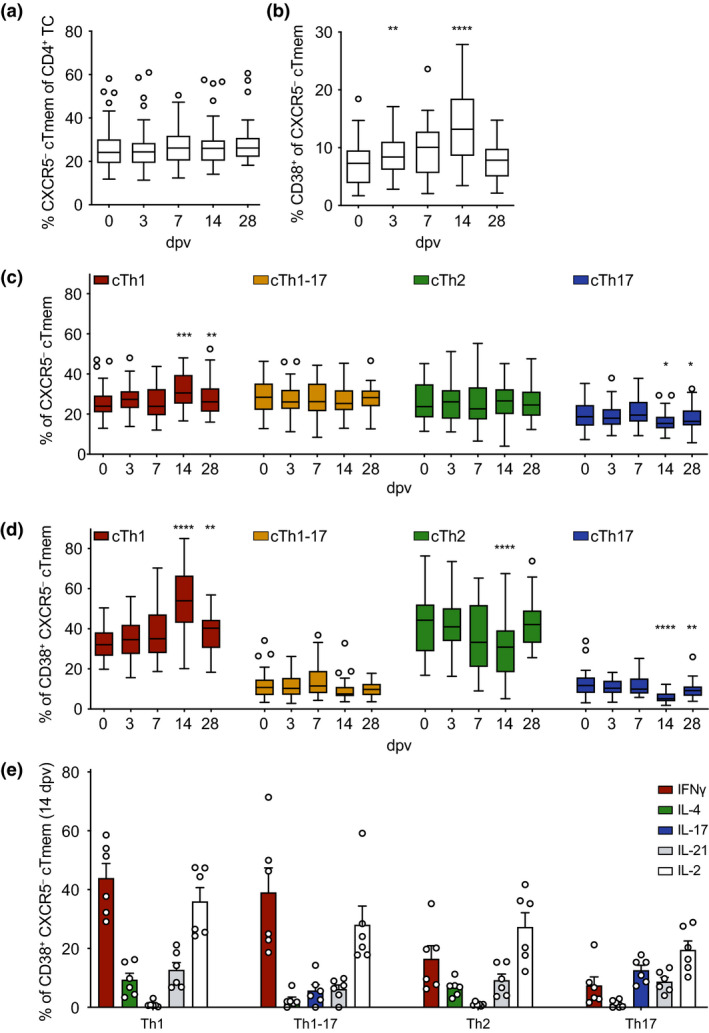
Figure 3.

Kinetics, activation and subset composition of circulating CXCR5− T memory cells after YF‐17D vaccination. PBMCs isolated before (day 0) and at the indicated time points after YF‐17D vaccination were analysed by flow cytometry (see Supplementary figure 1 for the gating strategy). Frequencies of (a) circulating CXCR5− Tmem cells, (b) activated CD38+ CXCR5− cTmem cells, (c) CXCR5− cTmem cell subsets and (d) activated CD38+ CXCR5− cTmem cell subsets determined by CXCR3 and CCR6 expression are shown. (e) Frequencies of cytokine‐expressing CD38+ CXCR5− cTmem cells were measured by intracellular antibody staining after re‐stimulation ex vivo with PMA/ionomycin on day 14 after YF‐17D vaccination. (a–d) Pooled data from four independent experiments with 5 to 10 study participants each are presented as Tukey boxplots showing the median with the 25th and 75th percentile (n = 33) and whiskers and outliers calculated as highest and lowest observation below/above 1.5 times interquartile range. Data points below/above 1.5 times interquartile range are displayed individually. Statistical analysis was performed using RM one‐way ANOVA and Dunnett's multiple comparison analysis to compare indicated time points to day 0. *P < 0.0332, **P < 0.0021, ***P < 0.0002, ****P < 0.0001. (e) Representative data of one of four separately performed experiments are shown as mean and SEM with each dot representing one donor (n = 6).
