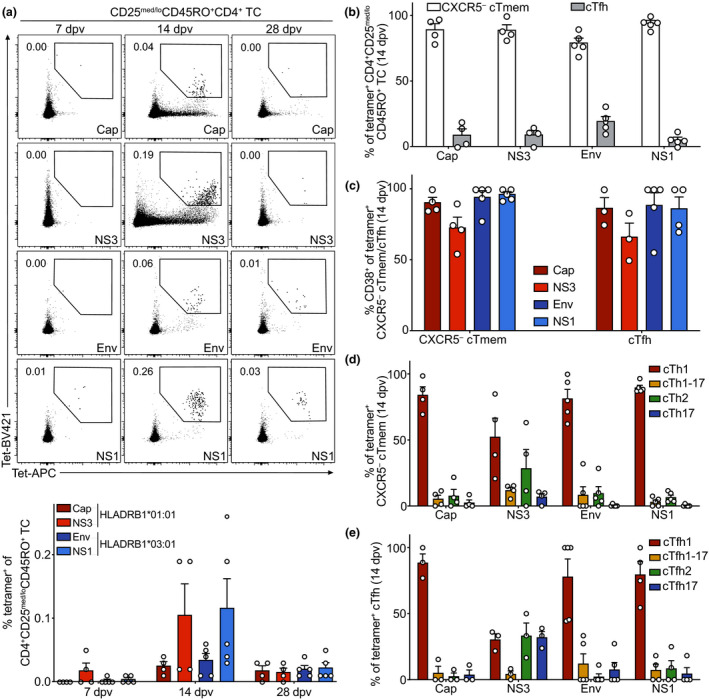
Figure 5.

Detection and analysis of YFV‐specific CD4+ T cells following YF‐17D vaccination. PBMCs isolated before (day 0) and at the indicated time points after YF‐17D vaccination were analysed by flow cytometry. (a) Representative contour plots and quantification of frequencies of YFV‐specific CD45RO+ CD4+ T cells determined by co‐staining with BV421‐ and APC‐labelled tetramers on days 7, 14 and 28 after vaccination are shown. Tetramers were HLA‐matched (HLADRB1*01:01 or HLADRB1*03:01) and presented YFV peptides derived from the Cap or NS3, and Env or NS1, proteins, respectively. (b–e) Frequencies of YFV‐specific (b) CXCR5− cTmem and cTfh cells, (c) CD38‐expressing activated CXCR5− cTmem and cTfh cells, (d) CXCR5− cTmem and (e) cTfh subsets were determined on day 14 after vaccination. Pooled data from three independent experiments are shown as mean with SEM, with each dot representing one donor (HLADRB1*01:01 n = 4, HLADRB1*03:01 n = 5). Donors with no cell counts for Tfh cells in b were excluded from the analysis in c and e.
