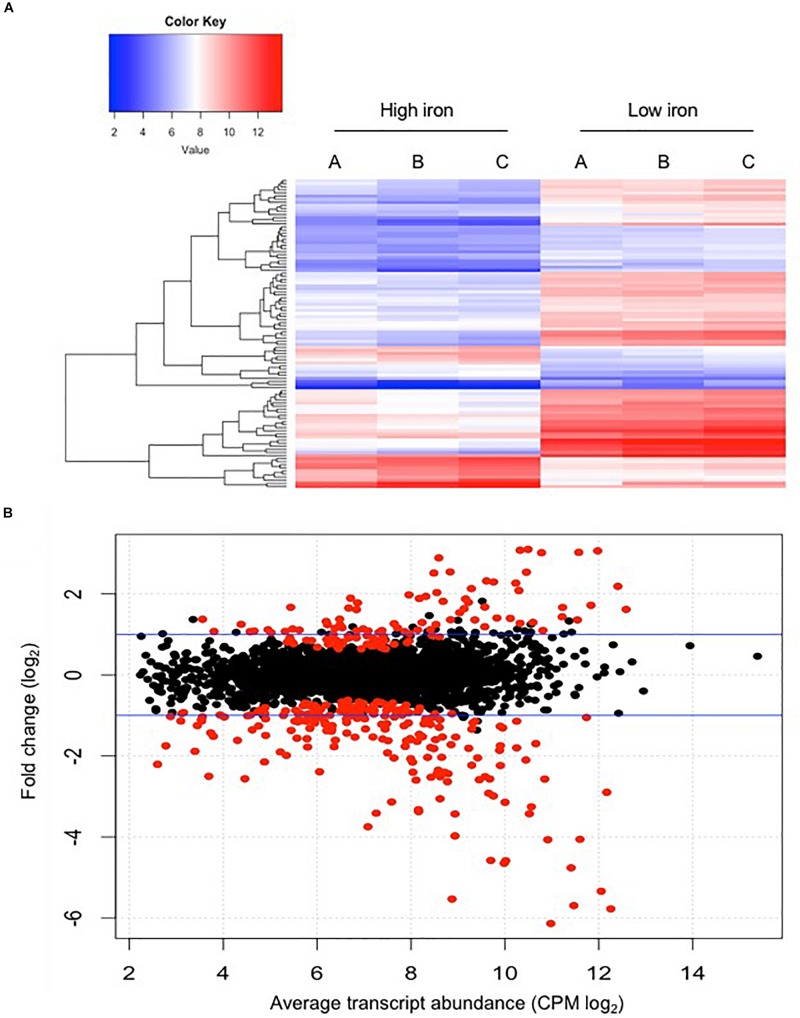
FIGURE 1.
Comparison of differential gene expression between E. anophelis Ag1 cultures held in low- and high-iron culture conditions. (A) Heat maps of 100 genes with significant regulation by iron availability. Left, high-iron condition; right, low-iron condition. (B) Magnitude amplitude plots generated by a modifying function within the edgeR package. Red dots indicate statistically significant genes (adjusted P < 0.05) and black dots are non-statistically significant differentially regulated genes. Blue lines indicate two-fold changes either up-regulated or down-regulated.

