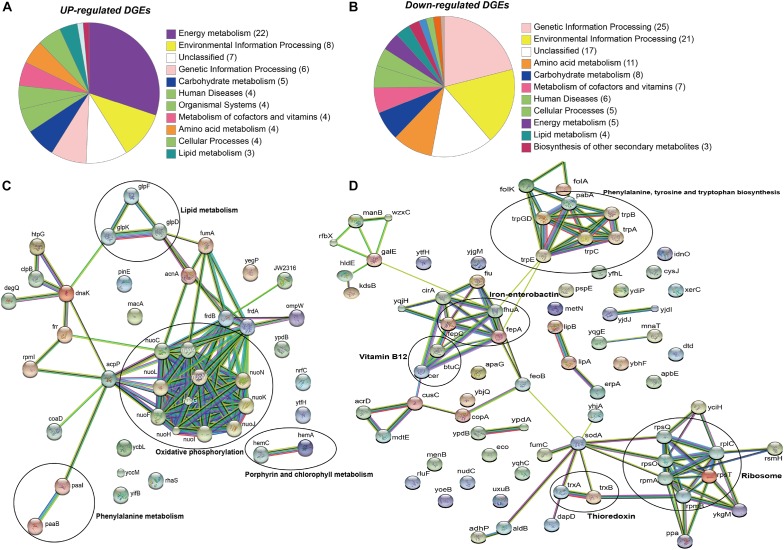
FIGURE 2.
KEGG and STRING analysis of differentially regulated genes in E. anophelis Ag1. (A) KEGG pathway enrichment analysis of up-regulated DEGs. Most of up-regulated DEGs were enriched to Energy Metabolism. (B) KEGG pathway enrichment analysis of down-regulated DEGs. Down-regulated genes were predominantly enriched in the Genetic Information Processing. (C) STRING analysis of up-regulated DEGs. Up-regulated DEGs were clustered to oxidative phosphorylation (circled). (D) STRING analysis of down-regulated DEGs. Down-regulated DEGs were clustered to ribosome and the biosynthesis of phenylalanine, tyrosine and tryptophan (circled).

