
Figure 5.
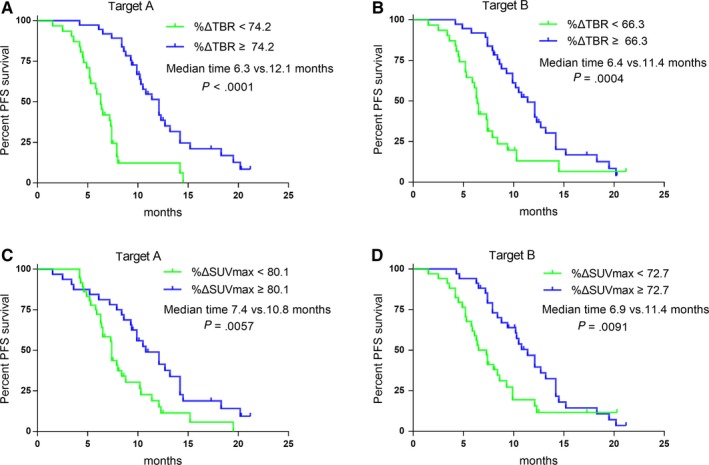
Kaplan‐Meier survival curves for PFS, according to %ΔTBR and %ΔSUVmax, for target A (A, C) and target B (B, D)
Official websites use .gov
A
.gov website belongs to an official
government organization in the United States.
Secure .gov websites use HTTPS
A lock (
) or https:// means you've safely
connected to the .gov website. Share sensitive
information only on official, secure websites.
Kaplan‐Meier survival curves for PFS, according to %ΔTBR and %ΔSUVmax, for target A (A, C) and target B (B, D)