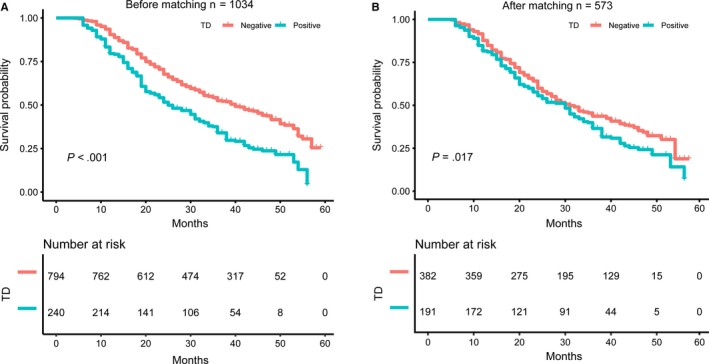
Figure 3.

Kaplan‐Meier curves for TD‐negative and TD‐positive gastric patients before and after propensity score matching. (A) Kaplan‐Meier curves for TD‐negative and TD‐positive gastric patients before propensity score matching. (B) Kaplan‐Meier curves for TD‐negative and TD‐positive gastric patients after propensity score matching. Abbreviation: TD tumor deposit
