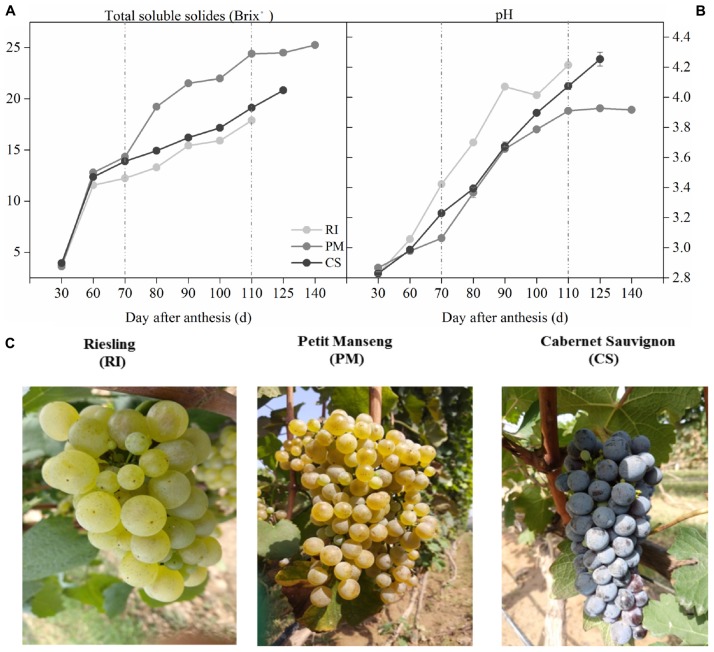
FIGURE 3.
The process of grape berries ripening among different genotypes. Images show the samples ripening collected at 30, 60, 70, 80, 90, 100, 125, and 140 DAA (day after anthesis), by the soluble solids (A) and pH (B) in three biological replicates. Image (C) shows the grapes at harvest. The light gray dots represent Riesling (RI), the dark gray dots represent Petit Manseng (PM), the black dots represent Cabernet Sauvignon (CS). Column value is shown by mean ± SD. Error bars represent the SD of the means.

