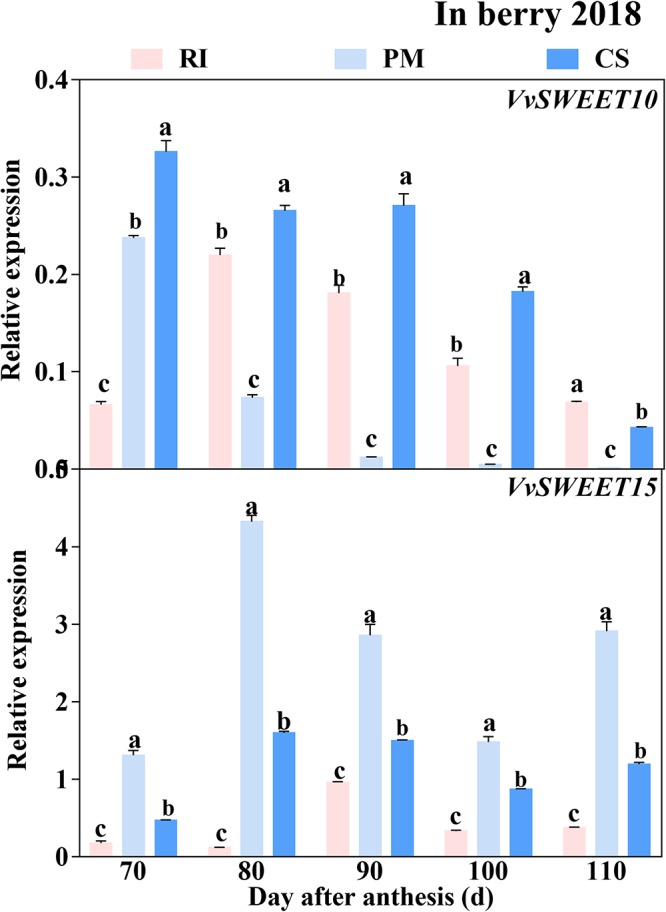
FIGURE 8.

The relative expression levels of VvSWEETs in the berry. The gene expression levels in the Riesling (RI, pink columns), Petit Manseng (PM, light blue columns), and Cabernet Sauvignon (CS, dark blue columns) berries at 70, 80, 90, 100, and 110 DAA, in three biological replicates. Column value is shown by mean ± SD. Error bars represent the SD of the means. Different letters (a, b, c) show significantly different at P < 0.05 level.
