
Figure 5.
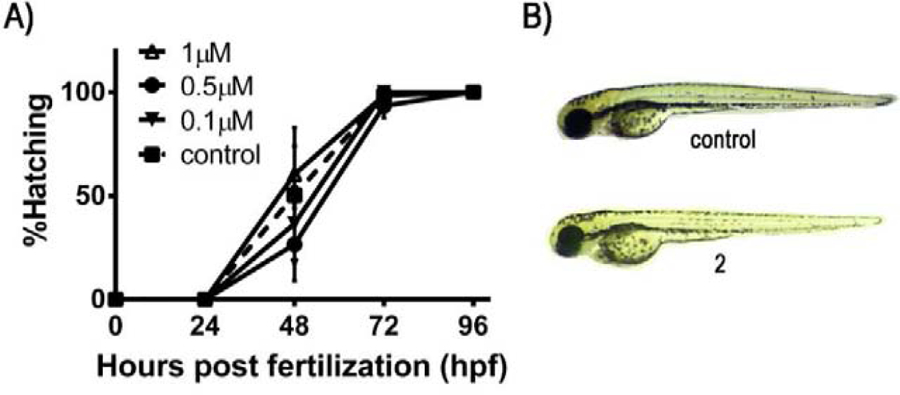
(A) Effect of 2 on the hatching rate of developing zebrafish embryos. Hatching rates were assessed at 0.1, 0.5 and 1 μM over 4 days post-fertilization (96 hpf). Control hatching rates are shown as a dashed line. (B) Gross morphological phenotypes of zebrafish embryos: untreated (control) and treated with 12.5 μM of 2. Results are expressed as means ± standard deviation of three independent experiments (a total of 60 embryos).