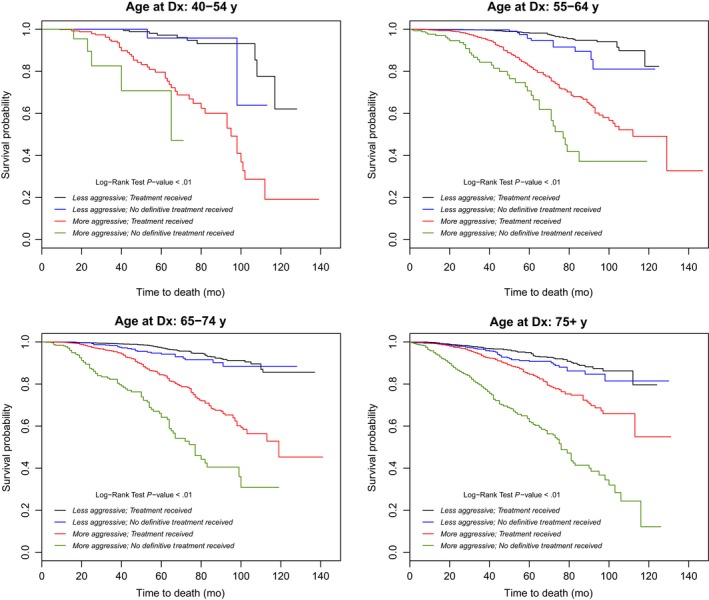
FIGURE 1.

Trends in prostate‐cancer mortality based on treatment received and disease aggressiveness, by age at diagnosis (Dx). Kaplan‐Meier curves visually illustrate prostate cancer aggressiveness and indication of prostate cancer treatment received. Less aggressive disease is represented by lines in black (with treatment received) and blue (with no definitive treatment received). More aggressive disease is represented by lines in red (with treatment received) and green (with no definitive treatment received). The four subplots summarize these trends by age‐related subgroups. All log‐rank test P‐values were <.01
