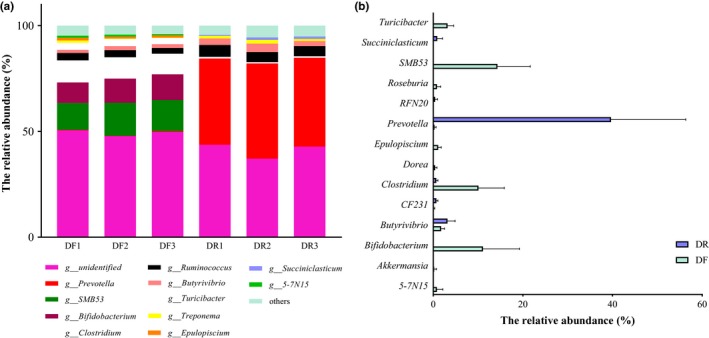
Figure 4.

(a) Relative abundance of genus by representation at ≥ 0.001% of total sequences. (b) Relative abundance of bacterial genera between DR and DF samples (relative abundance > 1%). All data are the means of 15 samples. *q < 0.05, **q < 0.01, and ***q < 0.001
