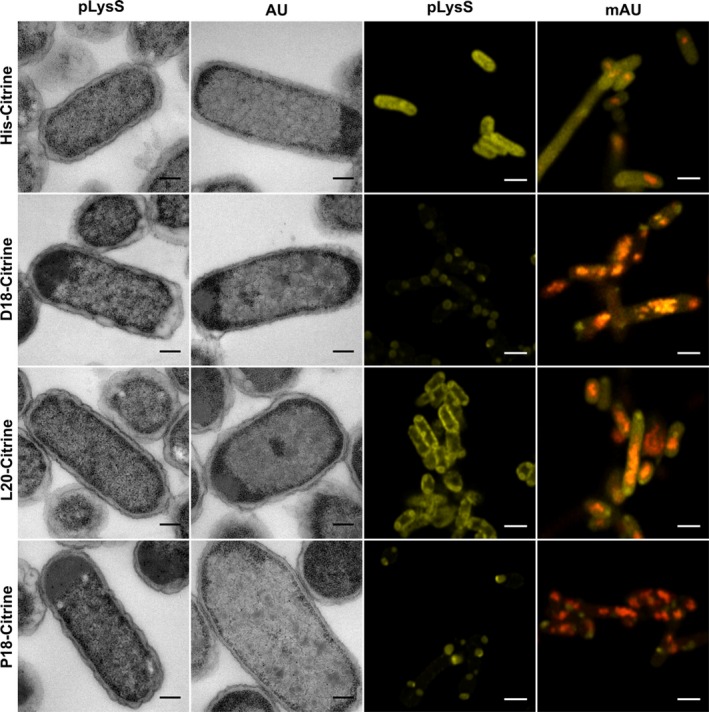
Figure 3.

Targeting of fluorescent proteins to recombinant Pdu BMCs. Transmission electron micrographs (left two columns) and confocal microscopy (right two columns) images of cells expressing differentially tagged Citrine in the presence and absence of mCherry‐tagged BMCs (mA‐U). Cells containing the empty pLysS vector are unable to produce BMCs, while those containing mA‐U within the pLysS vector produce BMCs with an mCherry tag as evidenced by red puncta within the cytoplasm. The production of Citrine is visualized by the presence of yellow. Superimposition of red and yellow is indicative of colocalization. Scale bars in TEM micrographs show 0.2 µm and in confocal images 2 µm
