
Figure A10.
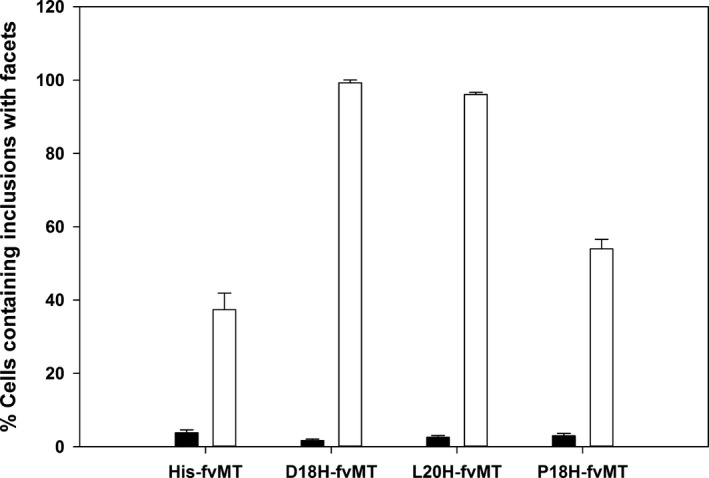
Quantification of aggregates containing facets observed in cells producing fvMT targeted to BMCs. Black bars indicate no compartment control, white bars—coproduced with PduA‐U. Error bars equal one standard deviation between three separate counts of a single biological repeat (n ≥ 220)