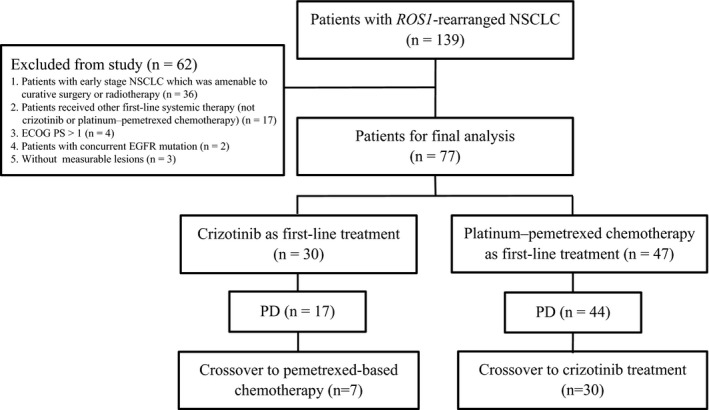
FIGURE 1.

Flow diagram illustrating study populations. ECOG PS, Eastern Cooperative Oncology Group performance status; NSCLC, non‐small‐cell lung cancer; PD, progressive disease

Flow diagram illustrating study populations. ECOG PS, Eastern Cooperative Oncology Group performance status; NSCLC, non‐small‐cell lung cancer; PD, progressive disease