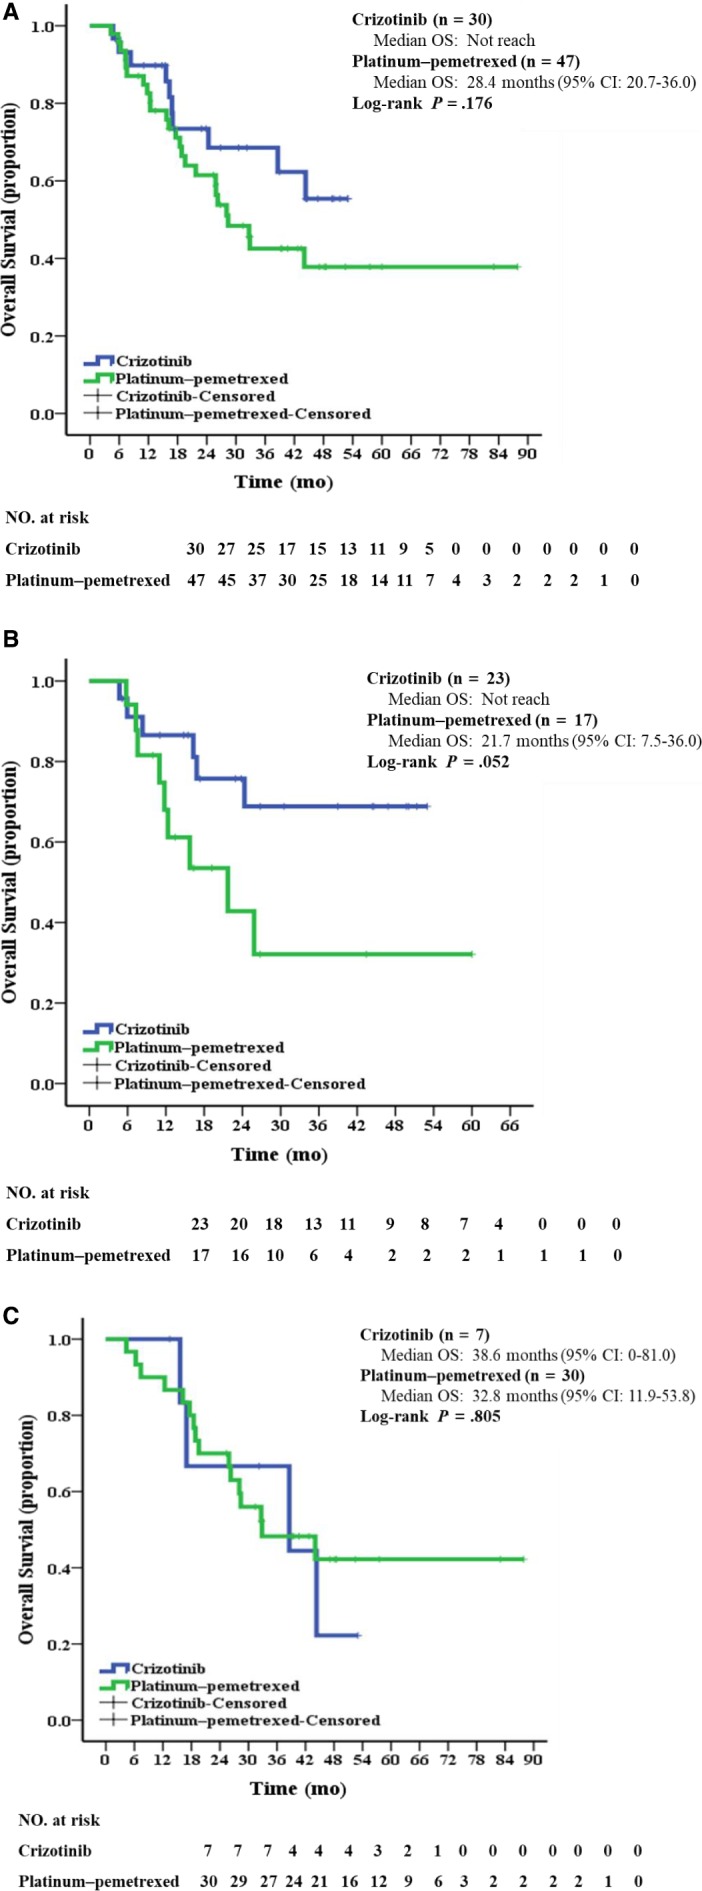
FIGURE 4.

Kaplan‐Meier curves of overall survival (A) in all patients treated with crizotinib or platinum‐pemetrexed chemotherapy as first‐line treatment (B) in patients who had not treatment crossover (C) in patients who had treatment crossover. CI, confidence interval; OS, overall survival
