Figure 1.

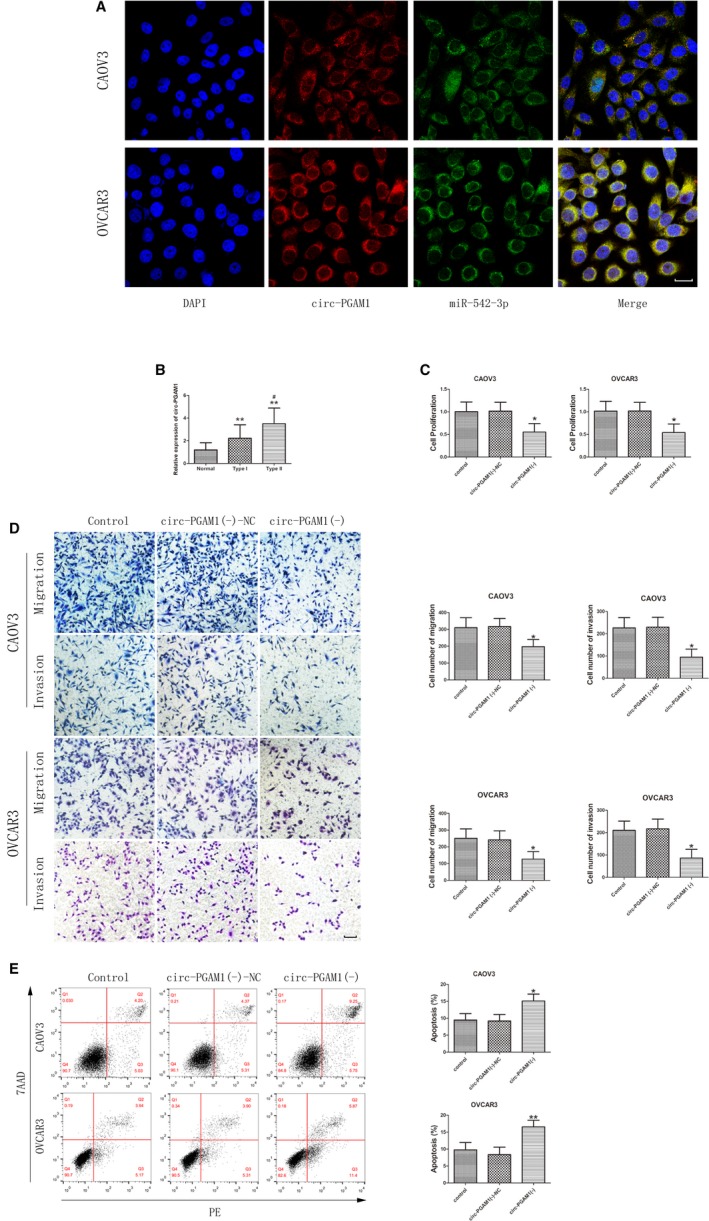
Circ‐PGAM1 functioned as an oncogene in epithelial ovarian cancer (EOC) tissues and cell lines. A, Fluorescence in situ hybridization (FISH) was used to determine the location of circ‐PGAM1 and miR‐542‐3p in CAOV3 and OVCAR3 (blue, DAPI nuclear staining; red, circ‐PGAM1; green, miR‐542‐3p). Scale bars represent 20 μm. B, Expression of circ‐PGAM1 in EOC tissue s of different types and normal ovarian tissues (data are presented as mean ± SD [n = 15, each group]; **P < .01 vs normal group; # P < .05 vs type I group). C, CCK‐8 assay was conducted to explore the effect of circ‐PGAM1 on proliferation of CAOV3 and OVCAR3 (data are presented as mean ± SD [n = 3, each group]; *P < .05 vs circ‐PGAM1 (−)‐NC group). D, Transwell assay was used to determine the effect of circ‐PGAM1on migration and invasion of CAOV3 and OVCAR3. Typical images and accompanying statistical plots were presented (data are presented as mean ± SD [n = 3, each group]; *P < .05 vs circ‐ PGAM1 (−)‐NC group). Photographs were taken at 200× magnification. Scale bar represents 100 μm. E, Flow cytometry was used to detect apoptosis of CAOV3 and OVCAR3with knockdown of circ‐PGAM1 (data are presented as mean ± SD [n = 3, each group]; *P < .05 vs circ‐ PGAM1 (−)‐NC group; **P < .01 vs circ‐ PGAM1 (−)‐NC group)
