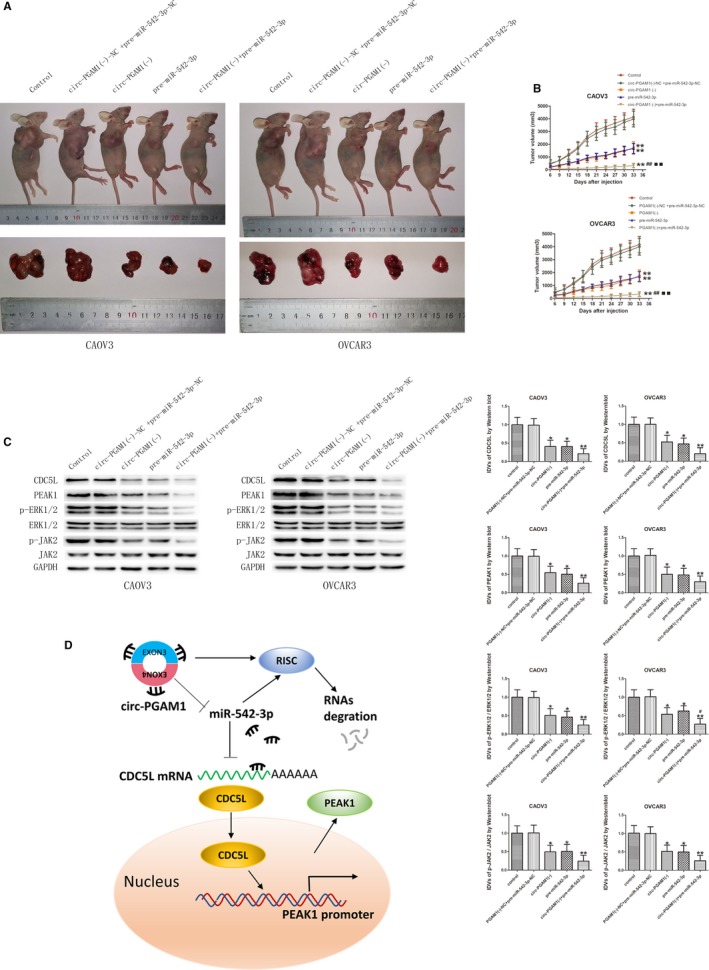
Figure 8.

In vivo study of tumor growth and expression of relative molecules in nude mice. A, The nude mice carrying tumors with altered expression of circ‐PGAM1 and mir‐542‐3p and the sample tumors from respective groups were shown. B, The tumor size was measured every 3 d and the tumor was resected 33 d a after injection (data are presented as mean + SD [n = 3, each group]; **P < .01 vs circ‐PGAM1 (−)‐NC + pre‐miR‐542‐3p‐NC group; ## P < .01 vs circ‐PGAM1 (−) group; ▪▪ P < .01 vs pre‐miR‐542‐3p group). C, Westernblot was used to detect the expression of p‐ERK1/2, ERK1/2, p‐JAK2 and JAK2 in tumor samples of respective groups (data are presented as mean ± SD; *P < .05 vs circ‐PGAM1 (−)‐NC + pre‐miR‐542‐3p‐NC group; **P < .01 vs circ‐PGAM1 (−)‐NC + pre‐miR‐542‐3p‐NC group; # P < .05 vs pre‐miR‐542‐3p group). D, Schematic cartoon of the mechanism of circ‐PGAM1 as an oncogene by regulating miR‐542‐3p/CDC5L/PEAK1 pathway in ovarian cancer cells
