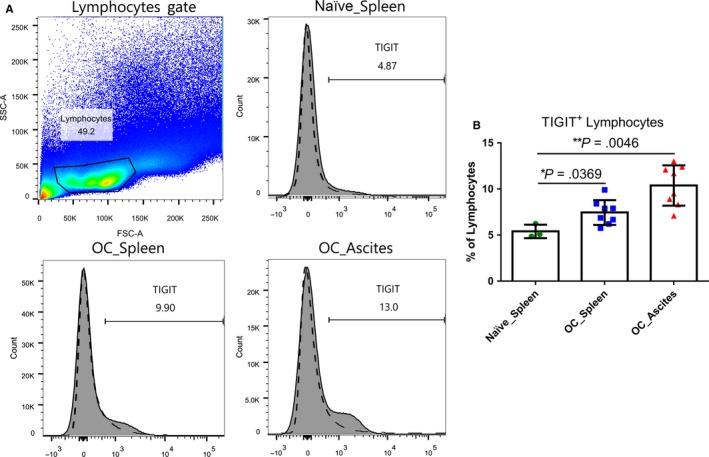
Figure 1.

Expression of TIGIT on lymphocytes of a murine OC. Mice (n = 8) were injected i.p. with 1 × 10⁶ ID8 cells. Seven days after injection, peritoneal lavage fluid and the spleen of OC and normal mice (n = 3) were collected, and mononuclear cells were isolated by Ficoll‐Paque density gradient centrifugation. The proportion of TIGIT + lymphocytes was assessed using flow cytometry (A). Dashed lines indicate TIGIT isotype controls; the shaded are in the histogram indicates TIGIT expression (B). “Naïve” indicates normal murine. Shown are the means ± standard deviation
