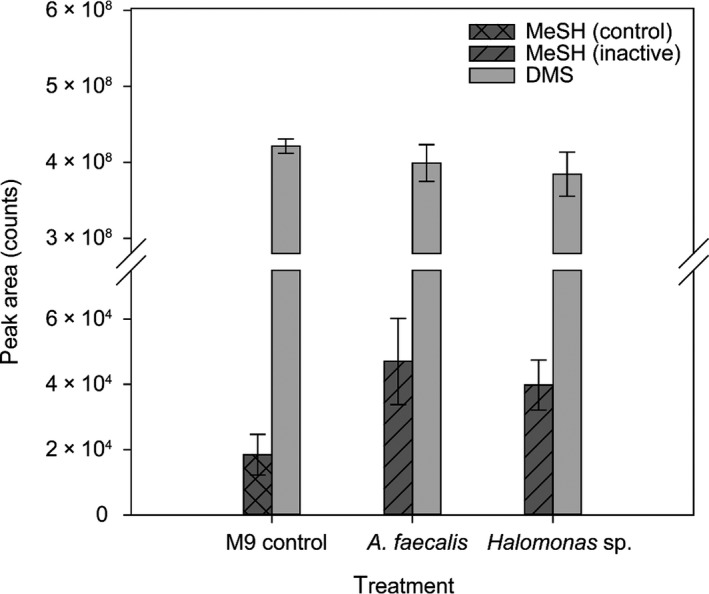
Figure A3.

Bacterial consumption of DMS and MeSH, respectively, over 24 hr at 28°C under constant agitation. Columns represent the peak area of the corresponding mass traces of MeSH (m/z = 48) and DMS (m/z = 62), respectively. M9 control corresponds to a noninoculated M9 minimal medium. Inactive treatment refers to cultures that were boiled for inactivation of enzyme activity. In the active cultures (living bacteria), no MeSH could be detected after 24 hr incubation. Error bars represent the standard deviation of individual replicates (n = 5)
