
FIGURE 5.
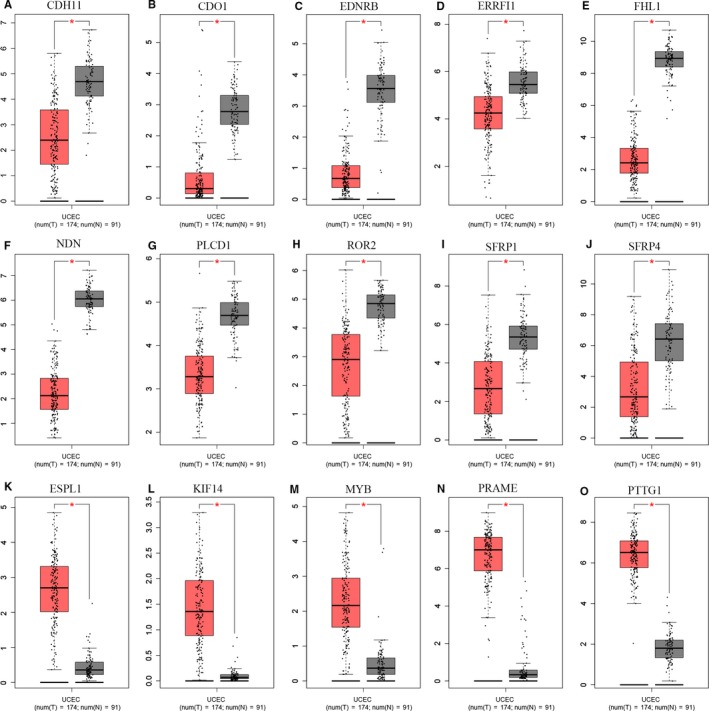
Validation of the 19 genes in the GEPIA. A‐D, Box plots showing the expression of the 15 genes was the same to that in our study based on GEPIA (P‐values < 0.05). The red node represented tumor samples, gray node represented normal samples
Official websites use .gov
A
.gov website belongs to an official
government organization in the United States.
Secure .gov websites use HTTPS
A lock (
) or https:// means you've safely
connected to the .gov website. Share sensitive
information only on official, secure websites.
Validation of the 19 genes in the GEPIA. A‐D, Box plots showing the expression of the 15 genes was the same to that in our study based on GEPIA (P‐values < 0.05). The red node represented tumor samples, gray node represented normal samples