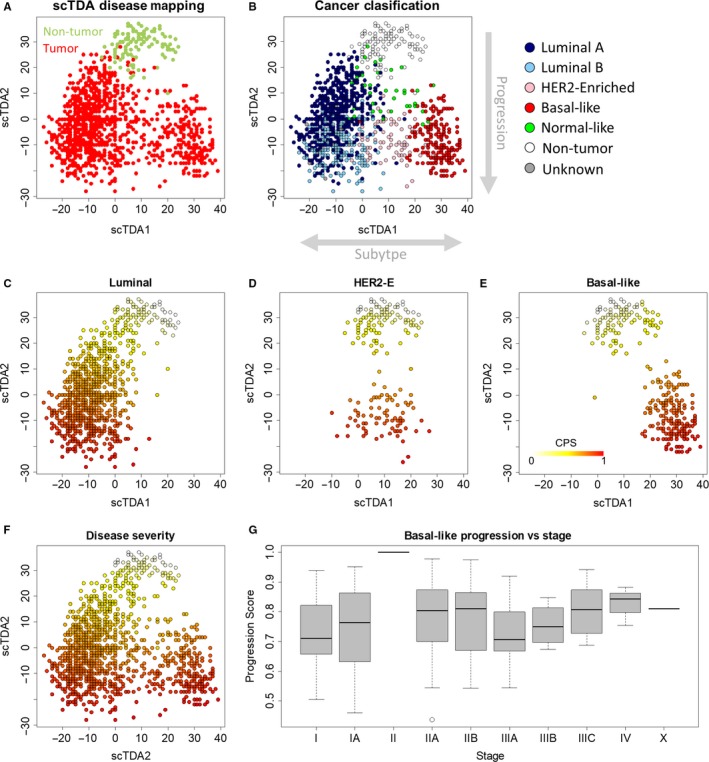
FIGURE 1.

Mapping BRCA treatment‐free progression. A, Double PCA/scTDA projection of breast cancer and pair‐matched nontumor breast RNA‐seq data showed gene expression separated nontumor from tumor samples. Tumor samples further separated into three groups. Each sample was represented by one point. B, ScTDA axis 1 separated tumors based on PAM50 classification. ScTDA axis 2 appeared to separate tumors based on similarity to nontumor tissue, suggesting that scTDA2 may capture cancer progression. C‐E, CPS for each progression trajectory estimated using consensus Wanderlust. F, Composite CPS for all progression trajectories. G, Relationship between cancer stage and CPS for basal‐like breast cancer. CPS tended to increase with increasing cancer stage. CPS, Cancer Progression Score; PCA/scTDA, principal component analysis/single‐cell topological density analysis
