
Figure 2.
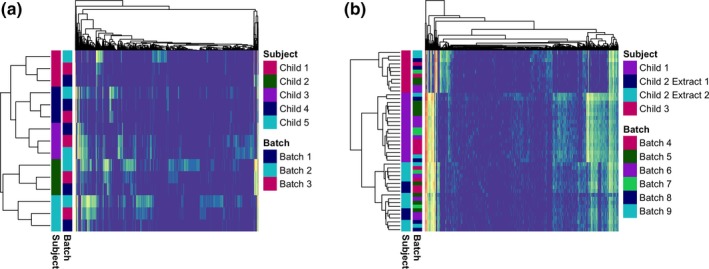
(a) Heat map depicting Set 1 generated with the pheatmap package in R. Samples and OTUs are clustered by Euclidean clustering. Subject and batch are annotated on the y‐axis. (b) Heat map depicting Set 2 generated with the pheatmap package in R. Samples and OTUs are clustered by Euclidean clustering. Subject, extraction, and batch are annotated on the y‐axis