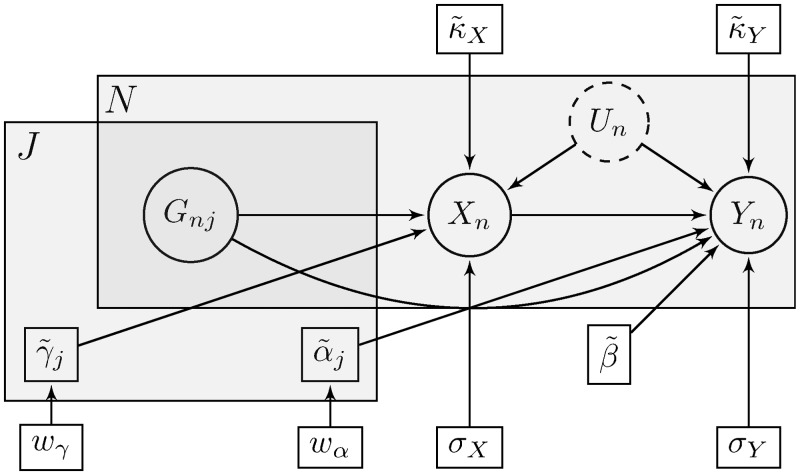
Figure 10.
Compact description of the Bayesian inference process using plate notation. The small rectangles indicate our model parameters, while the circles denote random variables (observed or unobserved). The gray superposed areas signify replication across the J genetic variants and the N data points. This is also suggested by the subscripts used for parameters and variables.

