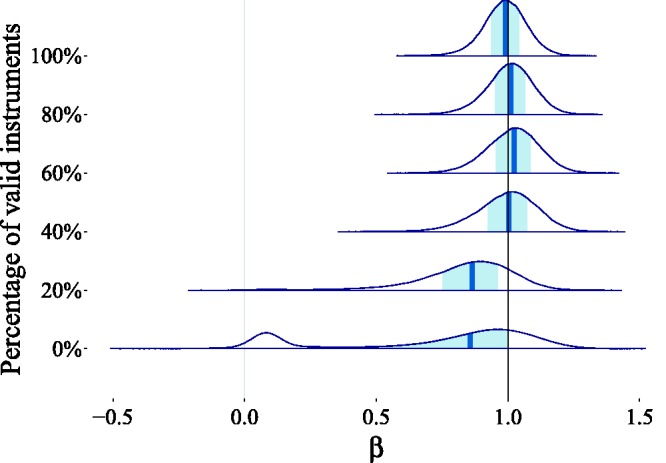
Figure 15.

The effect of introducing pleiotropic effects on the posterior estimates is that the distribution moves away from the true value . The shaded area in each posterior distribution corresponds to the 50% posterior uncertainty (credible) interval, with the posterior median in the center depicted with a vertical line. In the worst case scenario, where no genetic variant is a valid instrument, we observe the appearance of a second mode of the distribution, which is close to zero. This mode corresponds to the model explanation of the data where there is a “weak” causal effect from exposure to outcome. We notice, however, that the posterior distribution progression is gradual, thereby showcasing the robustness of BayesMR to the presence of pleiotropy. When only 40% of the genetic variants were valid instruments, the posterior distribution remained robustly centered around . Even when none of the genetic variants satisfied the IV assumptions, a significant proportion of the probability mass could be found around the true value.
