
Figure 17.
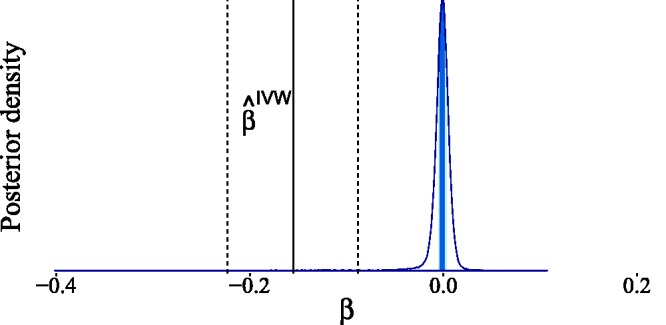
Estimated posterior distribution for the causal effect of birth weight on adult fasting glucose levels. The light shaded area in the posterior represents the interquartile range, while the dark shaded line indicates the median. For the Gaussian mixture prior in equation (7), we have taken and . The IVW estimate reported in Del Greco et al.70 and its confidence bounds are shown for comparison.