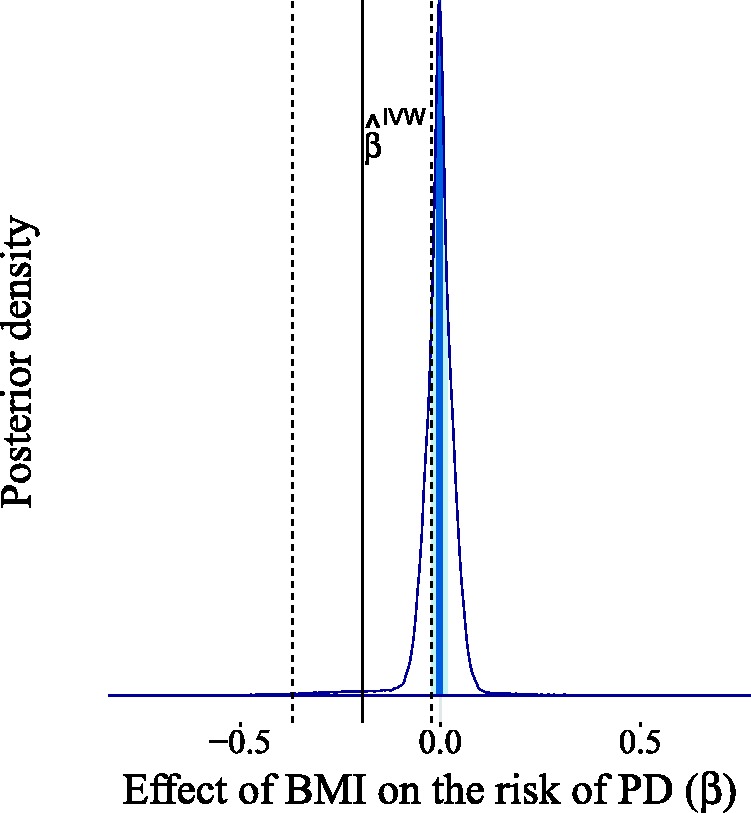
Figure 19.

Estimated causal effect of BMI on the risk of PD expressed as the difference in log-odds of PD per 5 kg/m2 increase in BMI. The light shaded area in the posterior represents the interquartile range, while the dark shaded line indicates the median. The IVW estimate derived from equation (3) along with its 95% confidence bounds are shown for comparison.
