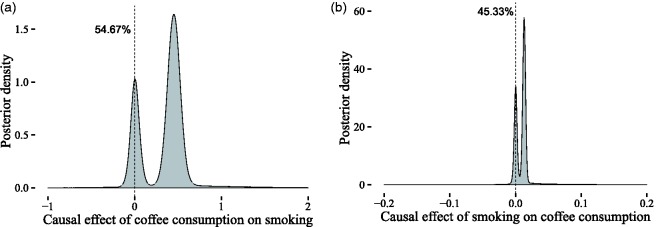
Figure 22.
Comparison of the causal effect estimates between X (coffee consumption in cups per day) and Y (heaviness of smoking in cigarettes per day) for the two possible causal directions. The estimated evidence for the two models is and , respectively. In the left figure, we see the estimate of , which is the causal effect of coffee consumption on heaviness of smoking, under the assumption that the causal link exists. In the right figure, we see the estimate of , which is the causal effect of heaviness of smoking on coffee consumption, under the assumption that the causal link exists. (a) Posterior distribution of the putative causal effect of coffee consumption on smoking. In the case of reverse causation (causal link from smoking to coffee consumption), this effect is zero, as indicated by the vertical dashed line. The estimate next to the line (54.67%) is the evidence for the reverse model. (b) Posterior distribution of the putative causal effect of smoking on coffee consumption. In the case of reverse causation (causal link from coffee consumption to smoking), this effect is zero, as indicated by the vertical dashed line. The estimate next to the line (45.33%) is the evidence for the reverse model.

