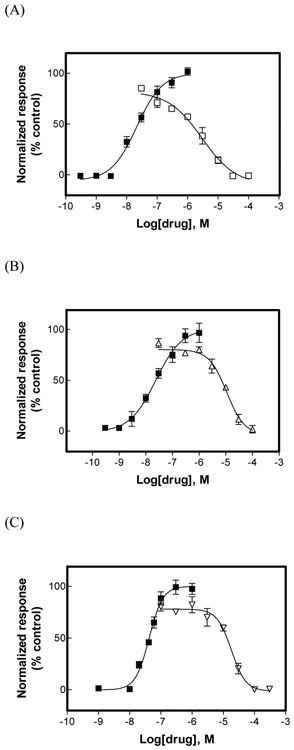
Fig. 1.
Effect of (±)-citalopram on (±)-epibatidine-induced Ca2+ influx in HEK293-hα3β4 (A), HEK293-hα4β2 (B), and GH3-hα7 (C) cells. Increased concentrations of (±)-epibatidine (■) activated each hα3β4 (A), hα4β2 (B), and hα7 (C) AChR. Subsequently, cells were pre-treated (5 min) with several concentrations of (±)-citalopram (□), followed by addition of 0.1 μM (+)-epibatidine. Response was normalized to the maximal (±)-epibatidine response which was set as 100%. The plots are representative of 4-5 determinations, where the error bars are the S.D. The calculated IC50 and nH values are summarized in Table 1.

