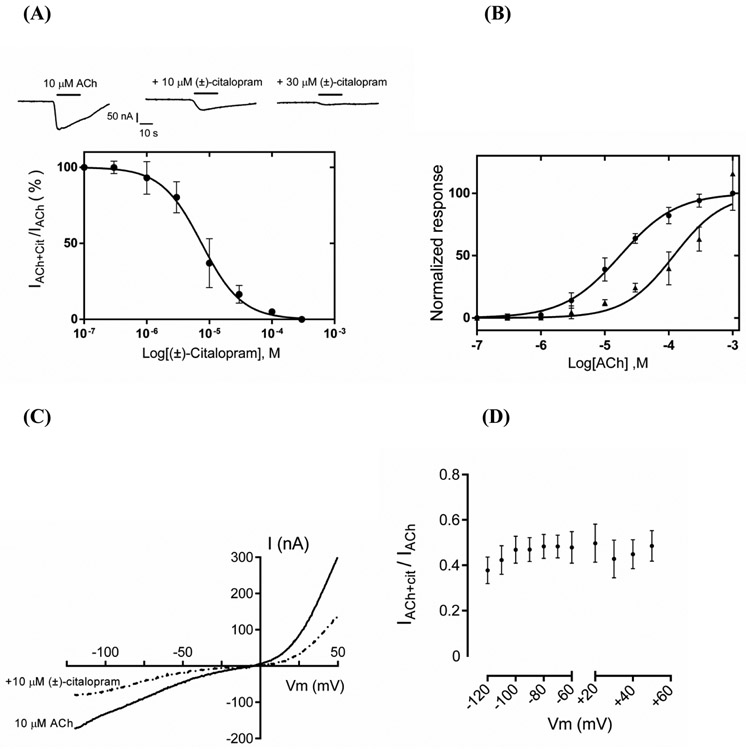
Fig. 2.
Effect of (±)-citalopram on acetylcholine (ACh)-evoked activity at rα9α10 AChRs expressed in Xenopus oocytes. (A) Responses of rα9α10 AChRs elicited by 10 μM ACh are diminished by increasing concentrations of (±)-citalopram. The inhibition curve was obtined by the co-application of 10 μM ACh and increasing concentrations of (±)-citalopram (r2 = 0.96; n = 7). Responses (mean ± SEM) were normalized to that elicited by 10 μM ACh (its EC50 value) which was set as 100%. The calculated IC50 and nH values are summarized in Table 1. (B) Concentration-response curves for ACh in the absence (●) and presence (▲) of 8 μM (±)-citalopram (n = 6). The EC50 values for ACh in the absence and presence of (±)-citalopram are summarized in Table 2. A statistical difference was obtained (p = 0.0001). (C) A representative current-voltage response (n = 7) obtained by applying 2-s voltage ramps from −120 to +50 mV, 10-s after the peak response to 10 μM ACh from a holding potential (Vhold) of −70 mV, in the presence and absence of 10 μM (+)-citalopram. (D) The comparison of (±)-citalopram-induced inhibition at different membrane potentials showed no statistical difference (Student’s t-test; p = 0.1), indicating a voltage-independent mechanism (n = 7).

