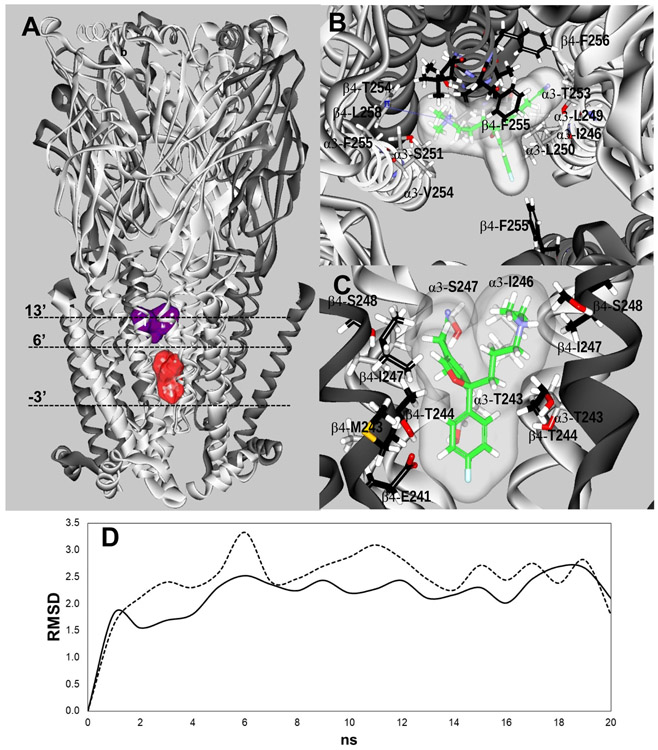
Figure 5.
(A) Docking sites for S-(+)-citalopram (escitalopram) at the h(α3)3(β4)2 AChR model. Escitalopram docked to two luminal sites (surface model), a high-affinity site located closer to the extracellular ion channel’s mouth (blue) and a low-affinity site located closer to the cytoplasmic side (red). α3 (white) and β4 (dark grey) subunits are represented as solid ribbons. Dotted lines indicate the positions of Gly (position −3’), Ser (position 6’), and Val (position 13’) rings along the ion channel. (B) In the high-affinity site, escitalopram (as sticks and its transparent surface model, colored by atoms with carbons in green) interacted with M2 residues located between positions 5' and 16', forming a strong H-bond with β4-T254 (position 12') (dotted black line), and a cation-π interaction with α3-F255 (position 14’) (solid blue line). (C) In the low-affinity site, escitalopram interacted with M2 residues located between positions −3' and 6'. A complete list of residues is summarized in Table 4. The interacting residues (as sticks) are labeled by their subunit, residue one letter code, and amino acid sequence number, and colored by atoms, including carbons (grey for the α3 subunit, and black for the β4 subunit), nitrogens (blue), oxygens (red), and hydrogen (white). (D) Molecular dynamics simulations (20 ns) of escitalopram interacting with the high- (—) and low-affinity (-----) sites, respectively, at the h(α3)3(β4)2 model.

