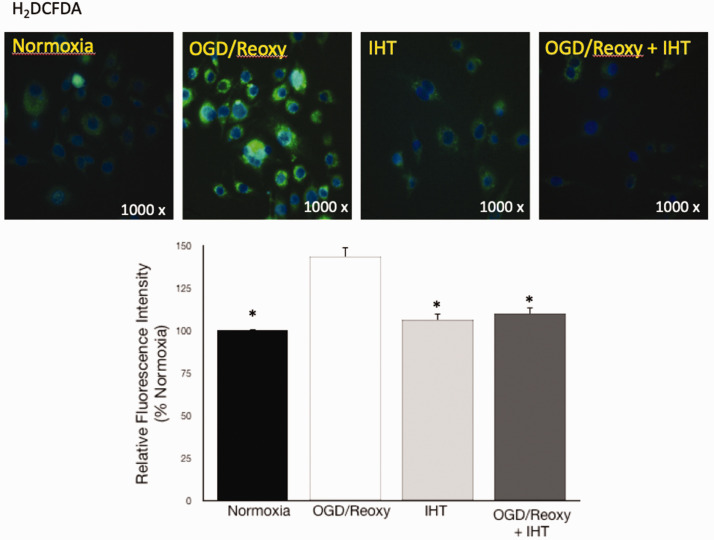
Figure 5.
IHT reduced ROS generation from microglia. ROS generation in the OGD and reoxygenation activated-microglia was dampened by IHT. The bar graph represents a quantitative analysis of the H2DCFDA spectrophotometry assay. *P < 0.05 vs. OGD/Reoxy. (A color version of this figure is available in the online journal.)

