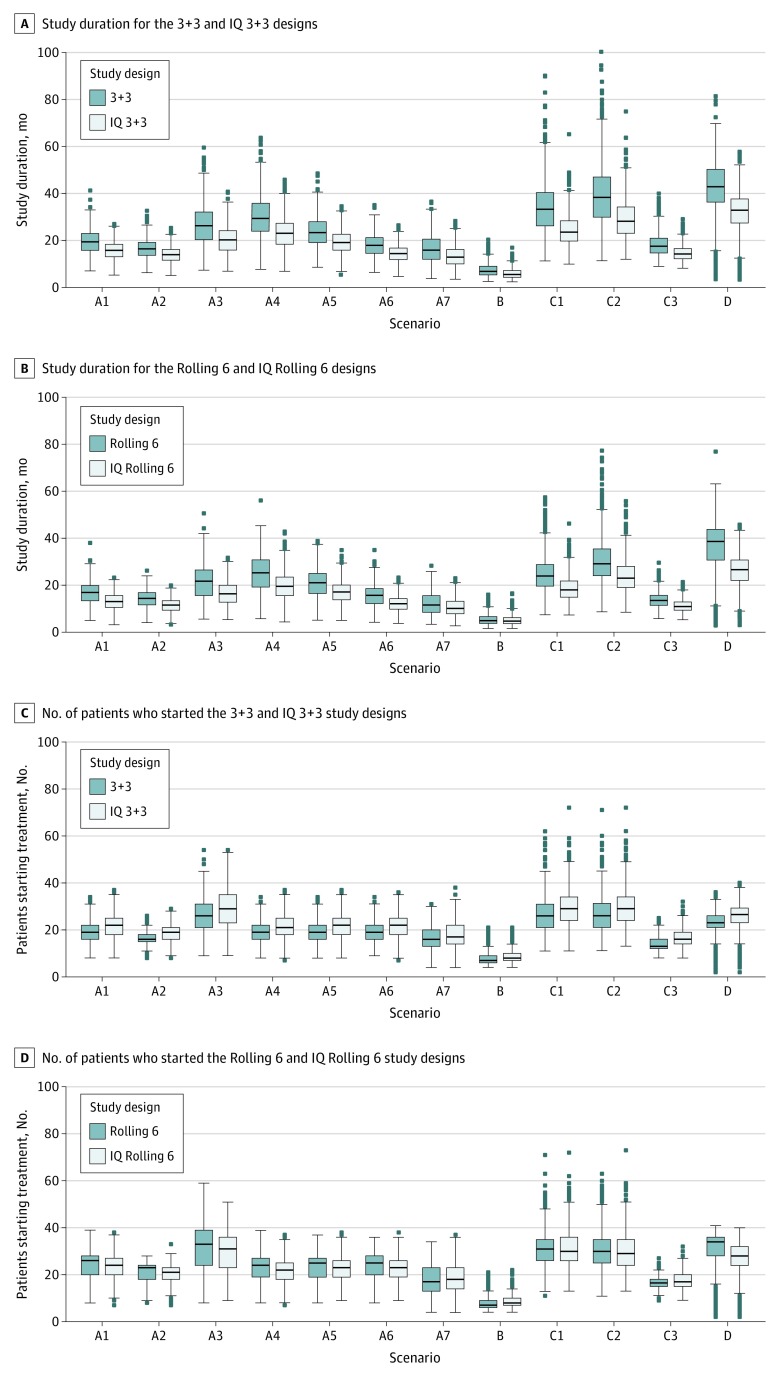
Figure 2. Box-Whisker Plots of Study Duration for the 3 + 3 and Phase 1 Queue (IQ) 3 + 3 and Rolling 6 and IQ Rolling 6 Designs.
A, Study duration for the 3 + 3 and IQ 3 + 3 studies. B, Study duration for the rolling 6 and IQ rolling 6 studies. C, Number of patients who started treatment for the 3 + 3 and IQ 3 + 3 designs. D, Number of patients who started treatment for the rolling 6 and IQ rolling 6 designs. Graphs are based on 800 simulations per scenario (Table 3).

