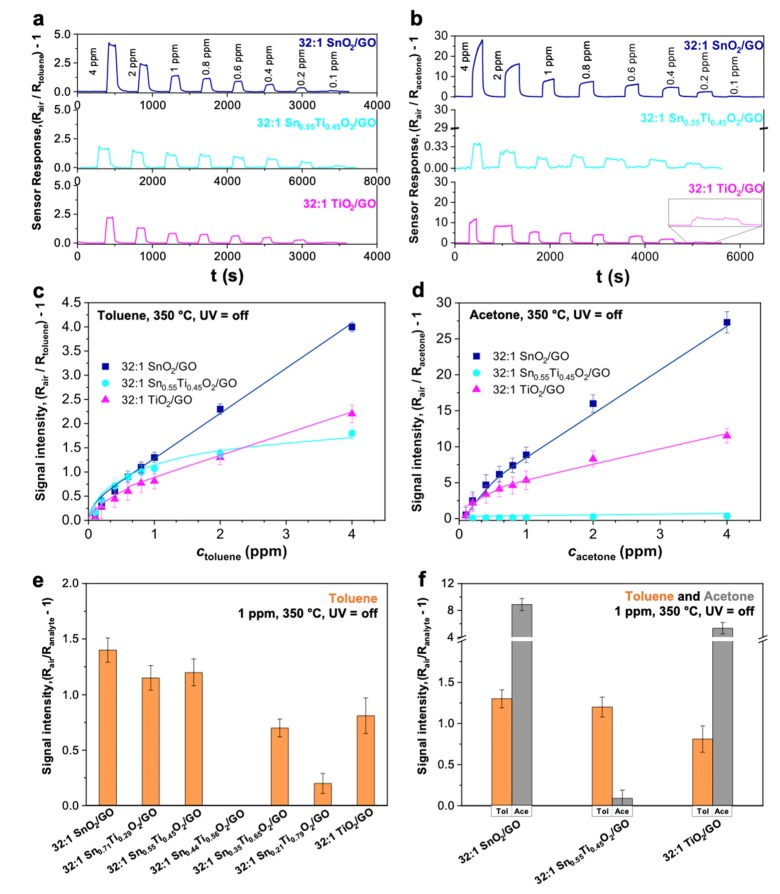
Figure 4.
32:1 SnO2/GO (blue line), 32:1 Sn0.55Ti0.45O2/GO (cyan line) and 32:1 TiO2/GO (fuchsia line) sensor signals towards (a) toluene and (b) acetone molecules. Sensor response intensities towards (c) toluene and (d) acetone species. (e) Histograms displaying a comparison of the response intensity obtained with the solid solutions towards 1 ppm of toluene analyte. (f) Comparison of the intensities at 1 ppm of toluene (orange) and acetone (grey) obtained with the most promising 32:1 SnO2/GO, 32:1 TiO2/GO and 32:1 Sn0.55Ti0.45O2/GO samples. Tests were carried out in simulated air (20% O2–80% N2) at 350 °C, without UV light.

