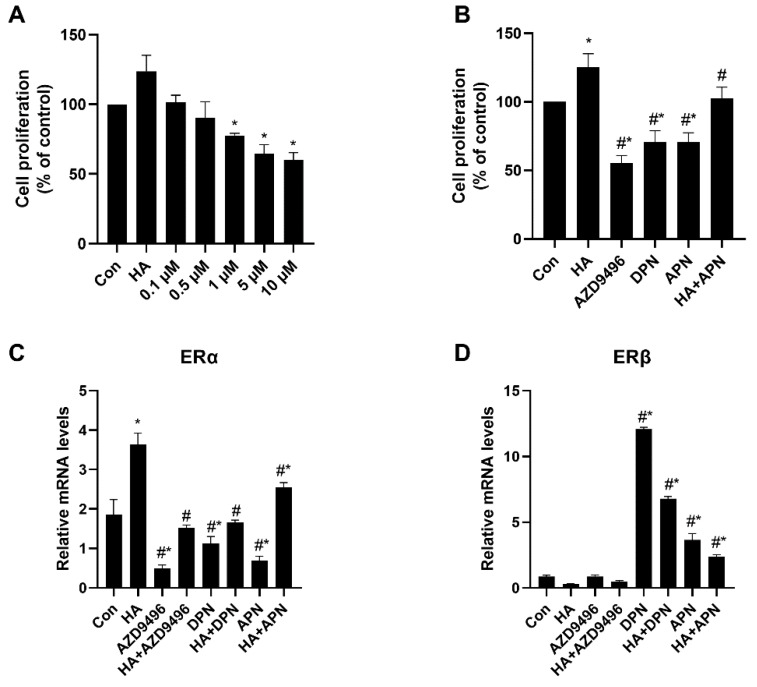
Figure 4.
Inhibition effects of apigenin on HeLa cell proliferation. (A) HeLa cell proliferation after treated with different concentration of apigenin (0.1, 0.5, 1, 5, 10 μM). Cell proliferation was measured after incubation with apigenin for 48 h. (B) Effects of HA, AZD9496, DPN and apigenin treatment on HeLa cell proliferation. The concentration of AZD9496 and DPN was 1 μM. (C) The mRNA expression levels of ERα. (D) The mRNA expression levels of ERβ. The results are expressed as a percentage of control, which is set at 100%. The concentration of apigenin used in (B–D) was 5 μM. The detailed primer sequence used in this part is shown in the materials and methods section. Data are presented as the mean ± SEM of at least three independent experiments. * p < 0.05 versus the control group, # p < 0.05 versus the HA group.

