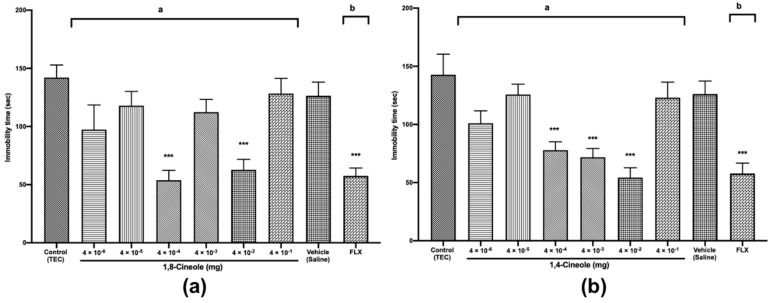
Figure 7.
Tail suspension test (TST) of mice treated with 1,8- (a) or 1,4-cineole (b) (4 × 10⁻⁶ to 4 × 10⁻¹ mg) or fluoxetine (20 mg/kg). The parameter analysed was immobility time in each test. The values are given as the mean ± SEM of 10 mice. The letter “a” indicates a significant difference when compared with the control (TEC); the letter “b” indicates a significant difference when compared with the vehicle (saline). Statistical differences vs. the control group were calculated by using Student’s t test or ANOVA followed by Dunnett’s test. (*** p < 0.001).

