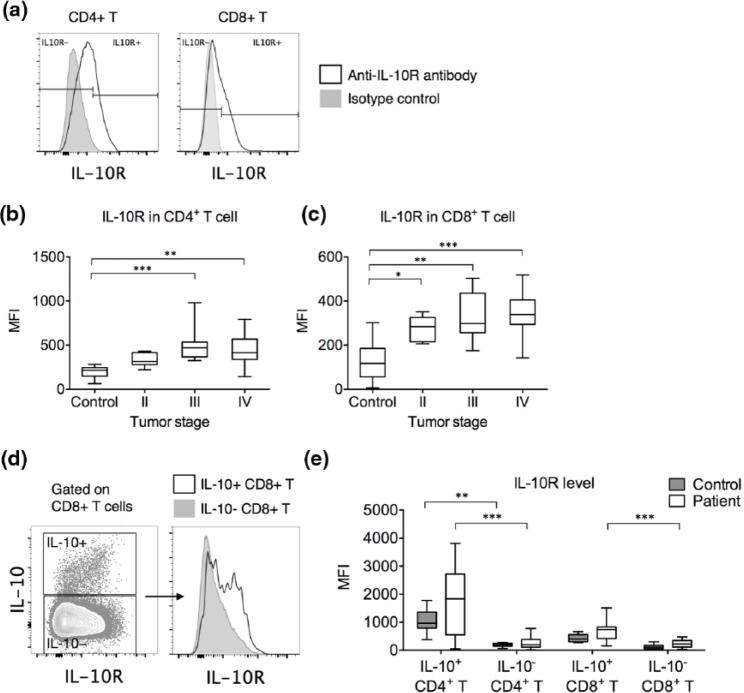
Figure 2.
IL-10R expression in CD4+ and CD8+ T cells in gastric cancer patients and controls. (a) Representative gating of IL-10R-expressing cells in CD4+ and CD8+ T cells. (b) Frequency of IL-10R-expressing cells as a percentage in CD4+ T cells in controls and gastric cancer patients of stages II–IV. (c) Frequency of IL-10R-expressing cells as a percentage in CD8+ T cells in controls and gastric cancer patients of stages II–IV. (d) Representative IL-10R expression by IL-10+ CD8+ T cells versus IL-10− CD8+ T cells (left: IL-10 vs IL-10R contour plot in CD8+ T cells and right: histogram comparison of IL-10R expression by IL-10+ (black unfilled) vs IL-10− (gray filled) CD8+ T cells). (e) Differences in IL-10R expression level between IL-10+ and IL-10− cells in CD4+ and CD8+ T cells from healthy controls and gastric cancer patients (*p < 0.05; **p < 0.01; ***p < 0.001).

