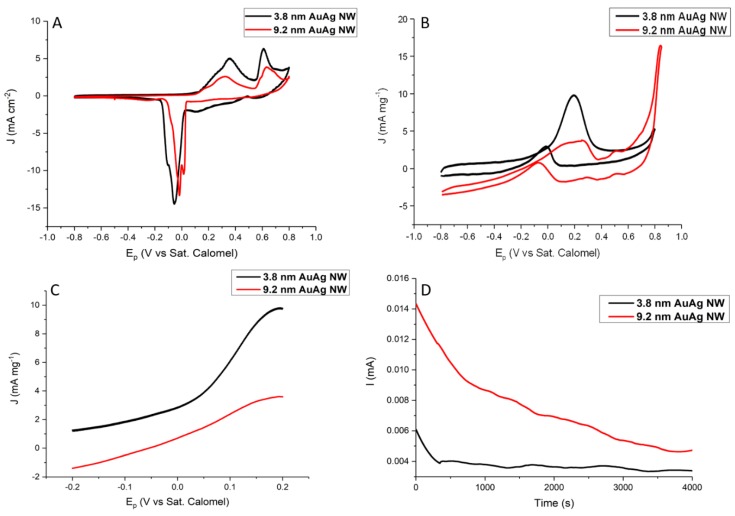
Figure 7.
Cyclic voltamogram (CV) curves (A) of 3.8 and 9.2 nm AuAg NWs in N2-saturated 1M KOH at 50 mV·s−1. (B) CV curves, (C) enlarged CV curves in the forward scan and (D) I–T curves over 4000 s for 3.8 and 9.2 nm AuAg NWs in N2-saturated 1 M KOH solution containing 0.5 M ethylene glycol (EG) versus the sat. calomel reference electrode.

