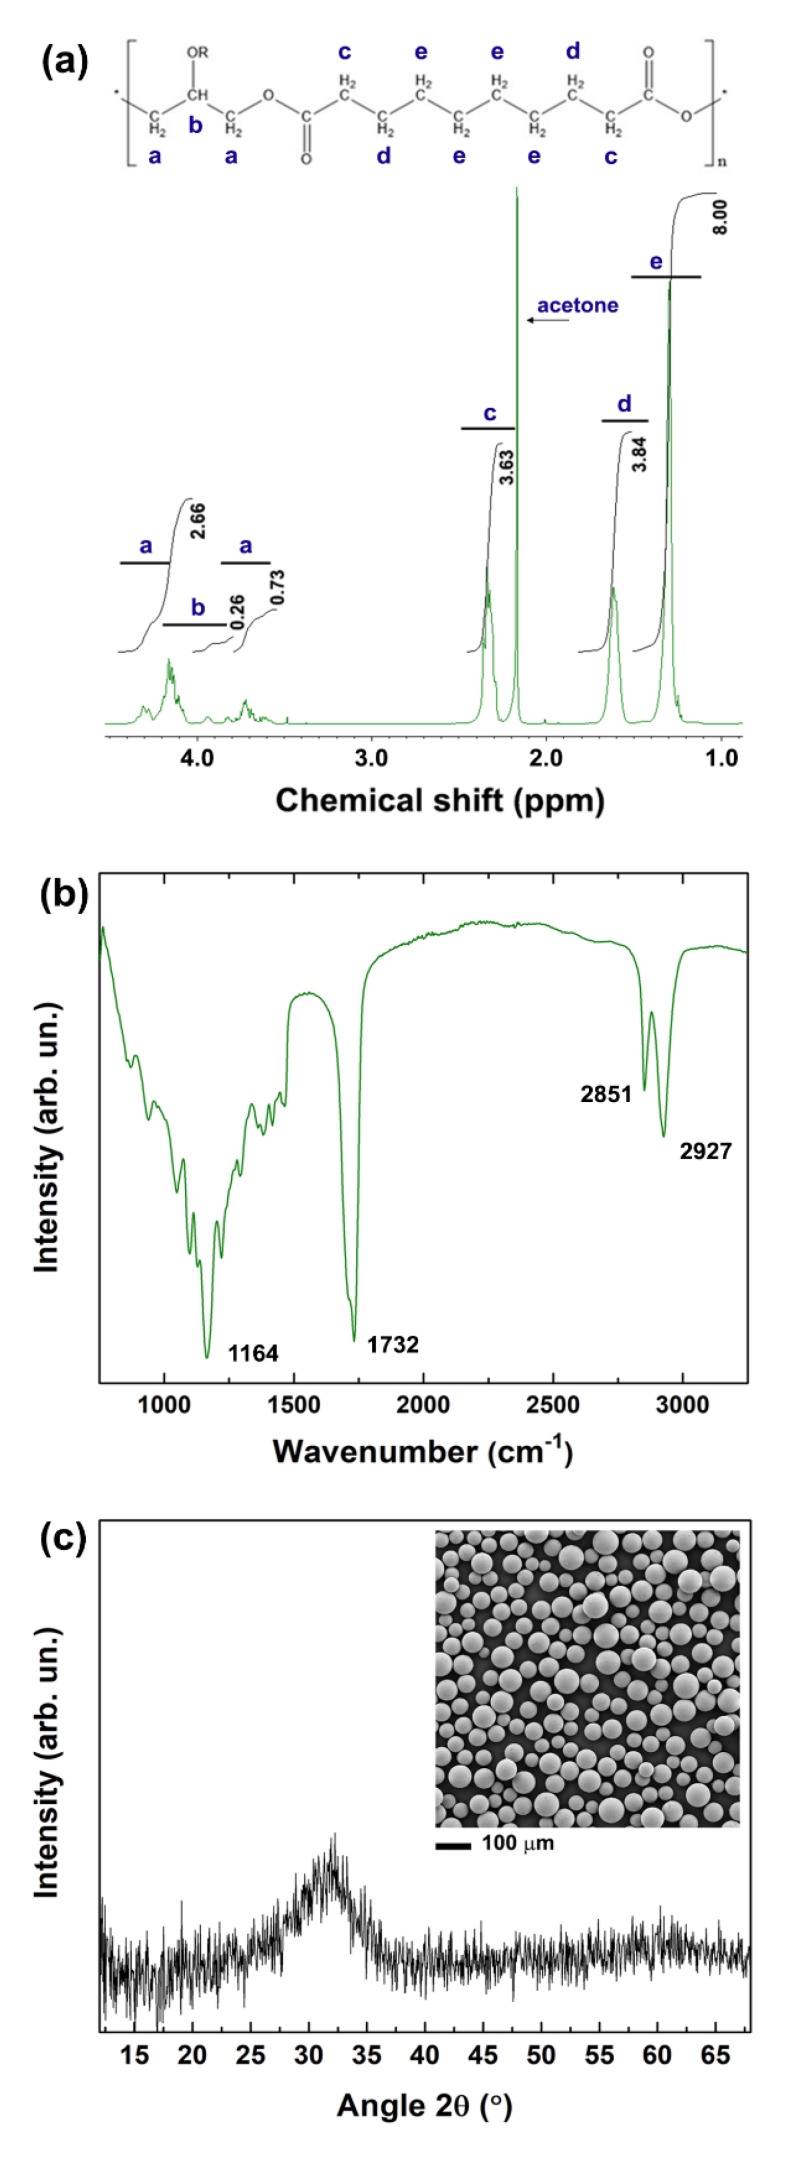
Figure 1.
(a) 1H NMR spectrum of poly (glycerol sebacate) (PGS) in deuterated acetone. The typical chemical structure of PGS is shown at the top of the graph. (b) FTIR spectrum of PGS. The characteristic peaks are indicated in the graph. (c) XRD pattern of the 45S5 bioactive glass microspheres and their morphology analysed by SEM (inset).

