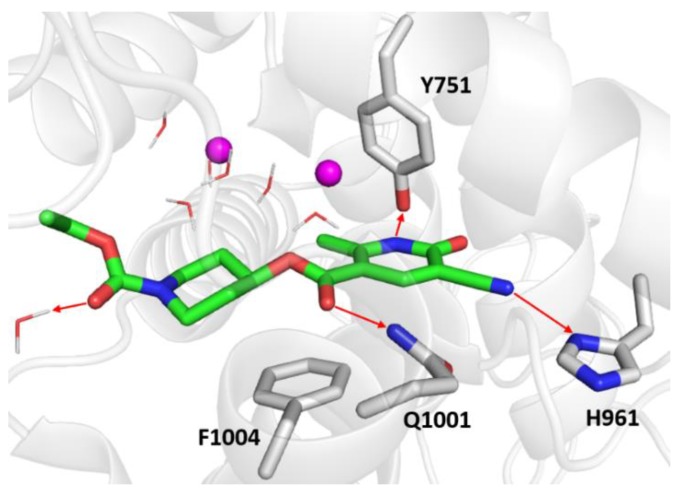
Figure 6.
Zoomed in view of the PDE3A binding site. DF492is rendered as green sticks in the representation, the most relevant residues are reported as gray sticks, the magnesium ions are indicated as violet spheres, and the water molecules are depicted as wireframes. The red arrows indicate the hydrogen bonds.

