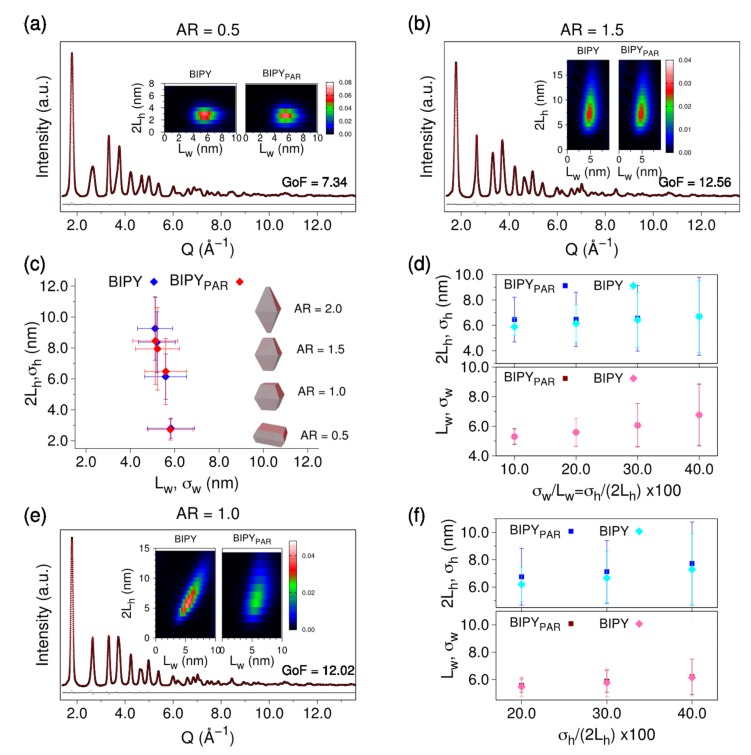
Figure 3.
Analysis of X-ray pattern simulations from anatase bipyramids (BIPY) NCs fitted using prismatic NCs, from which relevant parameters of the parent prismatic morphology (BIPYPAR) are extracted. (a,b,e) BIPY simulations (black dots, Poisson noise with S/N ≈ 700), best DSE fits (red traces) obtained using a bivariate population of tetragonal prisms by adjusting size and shape parameters. As these curves closely superimpose, the absolute residual trace (in gray), shown at the bottom, addresses the tiny mismatch between them. BIPY simulations correspond to <AR> = <2Lh>/<Lw> = 0.5 (a), <AR> = 1.5 (b), <AR> = 1.0 (e), 20% relative dispersion (σh/<2Lh > = σw/<Lw> = 0.2, φB = 0°) along the two growth directions in (a,b), and σh/<2Lh> = 0.4, σw/<Lw> = 0.1, φB = 30° in (e). Insets in (a,b,e) show the color-encoded (mass based) BIPY 2D maps and those recovered by the BIPYPAR model; (c) comparison of average size, shape, and dispersion parameters of BIPY at increasing <AR> (blue diamonds) with BIPYPAR-retrieved values (red diamonds) and fixed polydispersity. Horizontal and vertical bars represent the standard deviations of the lognormal distributions (σh = 0.2<2Lh> and σw = 0.2<Lw> in the BIPY population). The numerical outcomes of this plot are synoptically reported in Table A1; (d,f) BIPY and BIPYPAR size and size dispersion parameters at increasing σh/<2Lh> values, at φB = 0° (d) and φB = 30° (f). In both panels, results about Lw, σw from BIPYPAR models nearly superimpose onto the BIPY ones.

