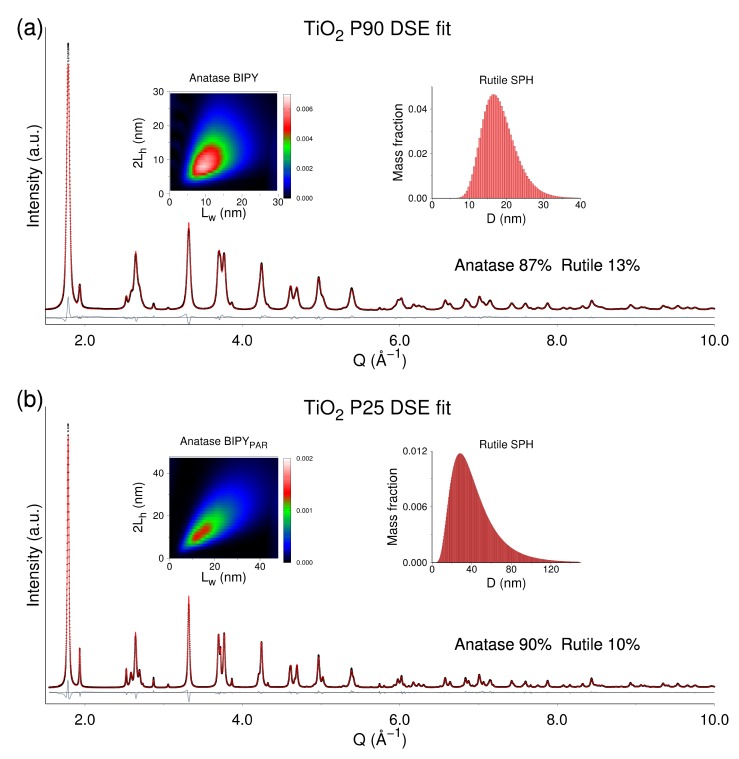
Figure 4.
Wide-angle X-ray scattering (WAXTS) data (black dots) and best fits (red curves) provided by the DSE-based method using a bivariate population of (a) bipyramids (BIPY) for anatase in P90 and (b) square parallelepipeds (PAR) for anatase in P25, and a univariate population of spherical NCs for rutile in both samples. Insets in (a) and (b) (left): 2D maps of the bivariate lognormal (mass-based) size distribution (in the Lw, 2Lh coordinates) of anatase NCs (BIPY in P90 and BIPYPAR in P25) and (right): (mass-based) univariate lognormal size distribution of rutile NCs.

