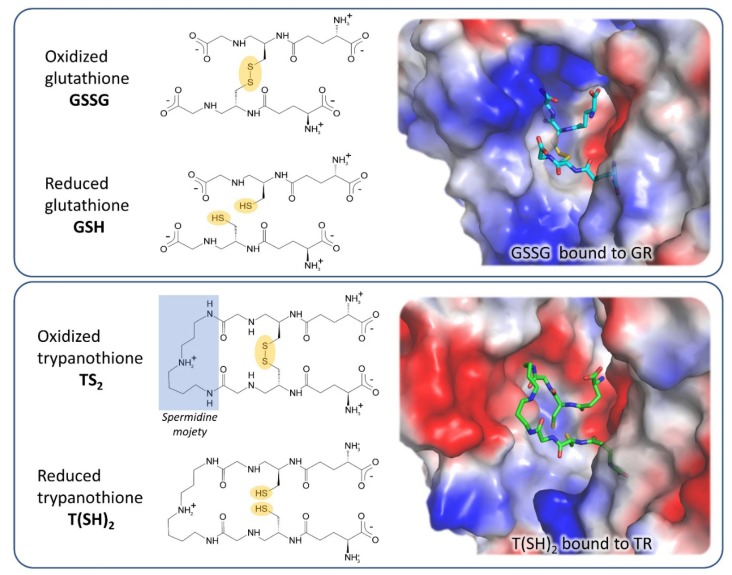
Figure 2.
Substrates and active site of glutathione reductase (GR) and TR. The comparison between the electrostatic potential surfaces of GR (upper panel, PDB: 1gra) and TR (lower panel, PDB: 1bzl) highlights the difference in size and charge of substrate binding sites, related to substrates features.

