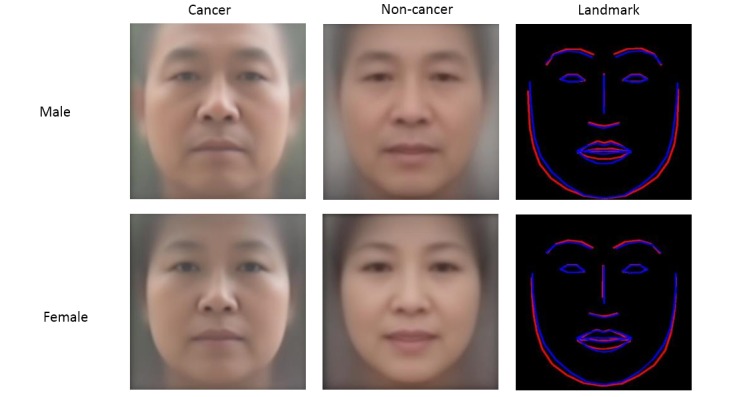
Figure 3.

Average faces and landmark comparison. Top row: male, bottom row: female. First column: cancer, second column: noncancer, and third column: landmark comparison (from left to right). In the third column, the landmark of the average cancer face is depicted in red and that of the average noncancer face is depicted in blue.
