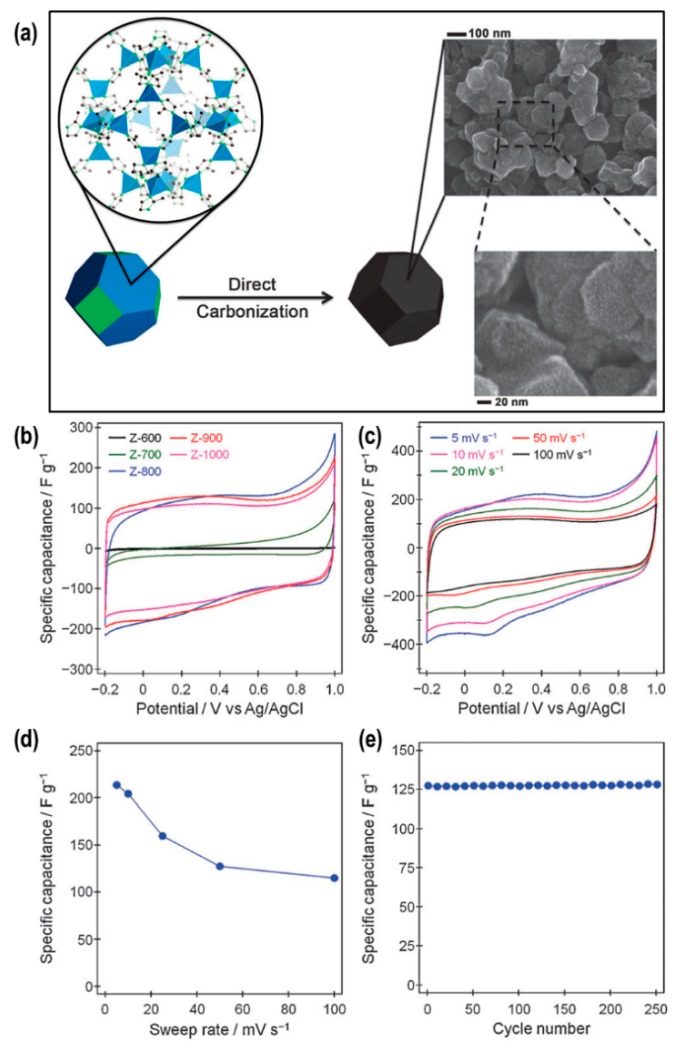
Figure 3.
(a) Schematic demonstration of ZIF-8−derived nanoporous carbons with SEM images of different magnifications. (b) CV curves a scan rate of 50 mV s−1 for different nanoporous carbon samples, (c) Corresponding CV curve vs. scan rate for the optimal sample Z−900, (d) Decay of specific capacitance vs. scan rate for Z−900, and (e) Corresponding cycle life at 50 mV s−1. Reproduced by permission of The Royal Society of Chemistry (RSC) from Reference [113], 2012.

