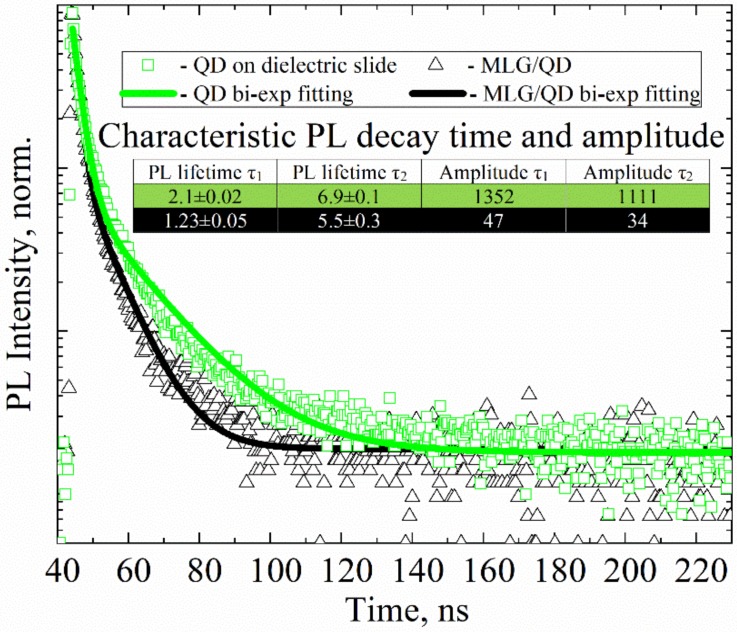
Figure 1.
Photoluminescence (PL) decay curves of 5.5 nm CdSe–ZnS quantum dots (QDs) on a dielectric slide (green rectangles) and in the multilayer graphene (MLG)–QD structures (black triangles). A 405 nm pulse laser was used for PL excitation of QDs. Solid lines (green and black) are biexponential fits of the decay. Inset: table showing the fitting parameters of PL decay curves.

