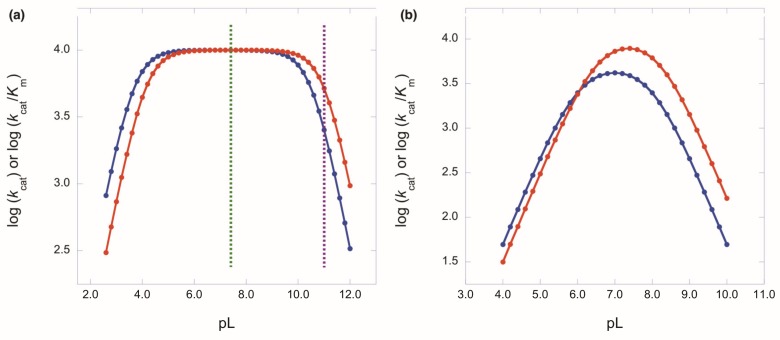
Figure 2.
Simulated pL–rate profiles in H2O (blue) and in D2O (red). (a) SKIE = 1; pKa1 = 3.65 (RCO2L); pKa2 = 10.53 (RNL3+). The green dashed line represents a suitable pL for measuring SKIEs accurately, while the purple line represents a pL that would lead to the false measurement of an inverse SKIE. (b) SKIE = 0.5; pKa1 = 6.0 (RSL); pKa2 = 8.0 (RNL3+). A plateau is absent because the two pKa values do not differ enough.

